
AI Agent Observability: How to Trace, Evaluate, and Debug Production Agents
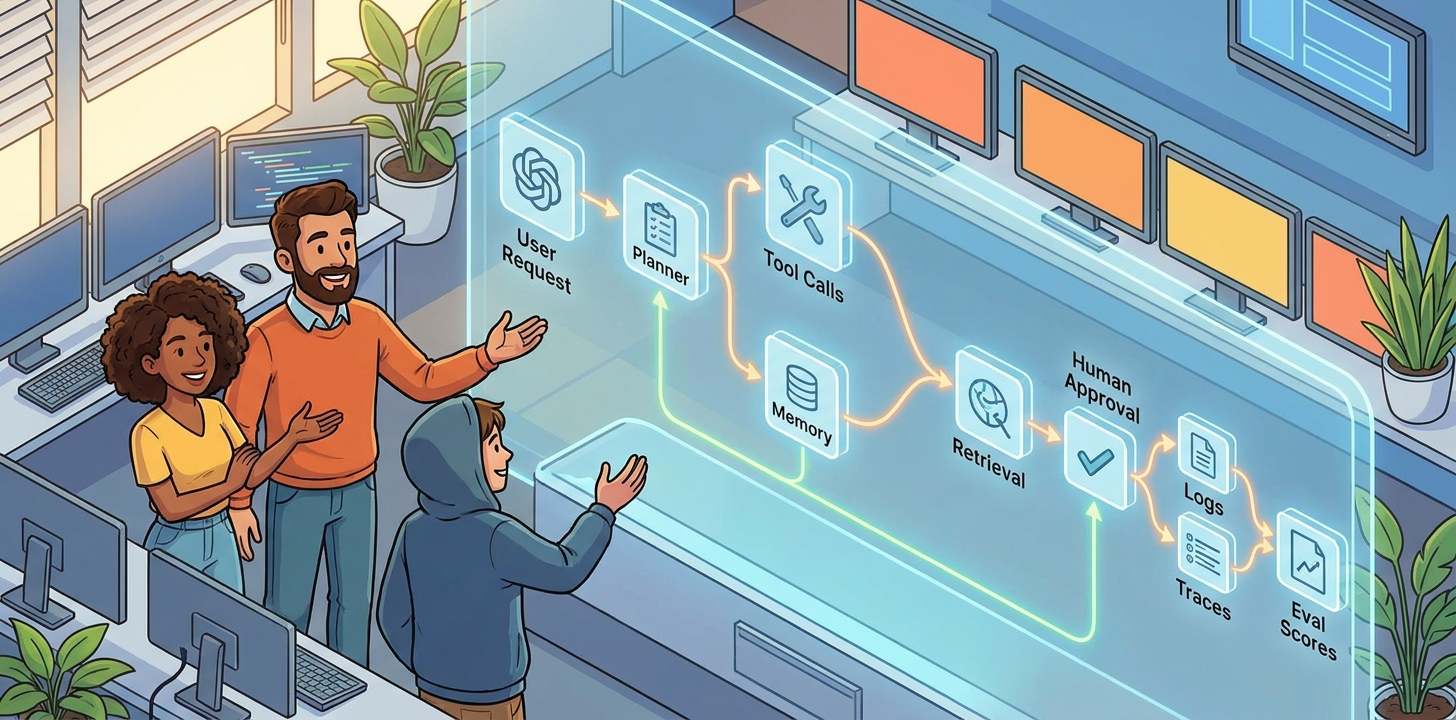
Most agent failures do not look like server crashes. They look like the agent choosing the wrong tool, trusting weak context, looping through retries, skipping a guardrail, or giving a confident answer nobody can reproduce. AI agent observability is how developers make those hidden decisions visible enough to debug, measure, and improve.
AI Agent Observability: Quick Answer for Developers
AI agent observability is the practice of capturing enough structured evidence from an agent run to understand what happened, why it happened, how much it cost, whether the result was good, and what should change before the next run. Traditional monitoring asks whether a system is up. Agent observability asks whether the agent made good decisions while it was up.
A useful observability setup records the user request, retrieved context, model calls, tool choices, tool arguments, tool results, memory reads and writes, guardrail decisions, human approvals, latency, token usage, errors, retries, final output, user feedback, and evaluation scores. That sounds like a lot, but the goal is simple: when a production agent fails, you should be able to replay the path, locate the weak step, and convert the failure into a test that prevents the same mistake from returning.
This guide is written for developers and technical teams building agents with frameworks such as LangChain, LlamaIndex, custom orchestration code, Model Context Protocol tools, retrieval systems, internal APIs, or cloud functions. It does not assume one vendor. The patterns work whether you use an open-source tracing tool, LangSmith, Arize Phoenix, Langfuse, Braintrust, OpenTelemetry pipelines, or a custom dashboard.
Why AI Agents Need Different Observability Than Normal Apps
A normal web service usually fails in familiar ways: an endpoint returns an error, a database query times out, CPU spikes, a queue backs up, or a dependency goes down. Those signals matter for agents too, but they do not explain the most important agent failures. An AI agent may return a successful HTTP response while still doing the wrong thing. It may call the right tool with the wrong arguments. It may retrieve irrelevant documents and then sound persuasive. It may spend money in loops. It may ask for human approval too late. It may pass unit tests but disappoint users because the answer is incomplete, unsafe, or hard to verify.
That is why agent observability needs to include semantic behavior. You are not only tracking infrastructure health. You are tracking a decision process. What did the agent believe the goal was? Which context did it use? Which tool did it select? What came back from that tool? Which rule blocked or allowed the action? Did the final answer match the source evidence? Was the user satisfied? Did a human reviewer override it?
The need is especially clear for production agents that operate across multiple steps. A simple chatbot answer may require one model call. A real agent might classify intent, search a knowledge base, call a CRM, create a ticket, request approval, send a reply, write a memory, and schedule a follow-up. If the final result is wrong, the bug could live in any step. Without a trace, every incident becomes a guessing game.
Current analytics for Singularity Journey support this direction. Search Console data is still early, but existing agent-related pages have begun earning impressions and small ranking signals. Pages such as secure MCP server tools and enterprise AI agent control planes show that developer-oriented agent operations topics fit the site. The gap is a practical pillar that connects tool-call tracing, evaluation, debugging, guardrails, and production runbooks in one place.
| Traditional monitoring asks | Agent observability also asks |
|---|---|
| Did the request fail? | Did the agent choose the right plan and tool? |
| How long did it take? | Which step caused latency: retrieval, model, tool, retry, or approval? |
| Was there an exception? | Was there a hallucination, weak source, unsafe action, or bad handoff? |
| How much traffic arrived? | Which intents, tasks, and tool paths are growing? |
| Did infrastructure recover? | Did the failure become a regression eval and a product improvement? |
The Anatomy of a Useful AI Agent Trace
A trace is the story of one agent run, broken into spans. Each span describes a meaningful step: the user request, the planner call, a retrieval query, a tool call, a safety check, a human approval, a retry, or the final response. The best traces are not giant raw transcripts. They are structured enough to filter, compare, score, and replay.
OpenTelemetry’s GenAI semantic convention work is important because it pushes the ecosystem toward shared names for generative AI telemetry. Even if the exact conventions evolve, the principle is stable: do not bury agent behavior in random strings. Capture fields consistently so your traces can move across tools, dashboards, and teams.
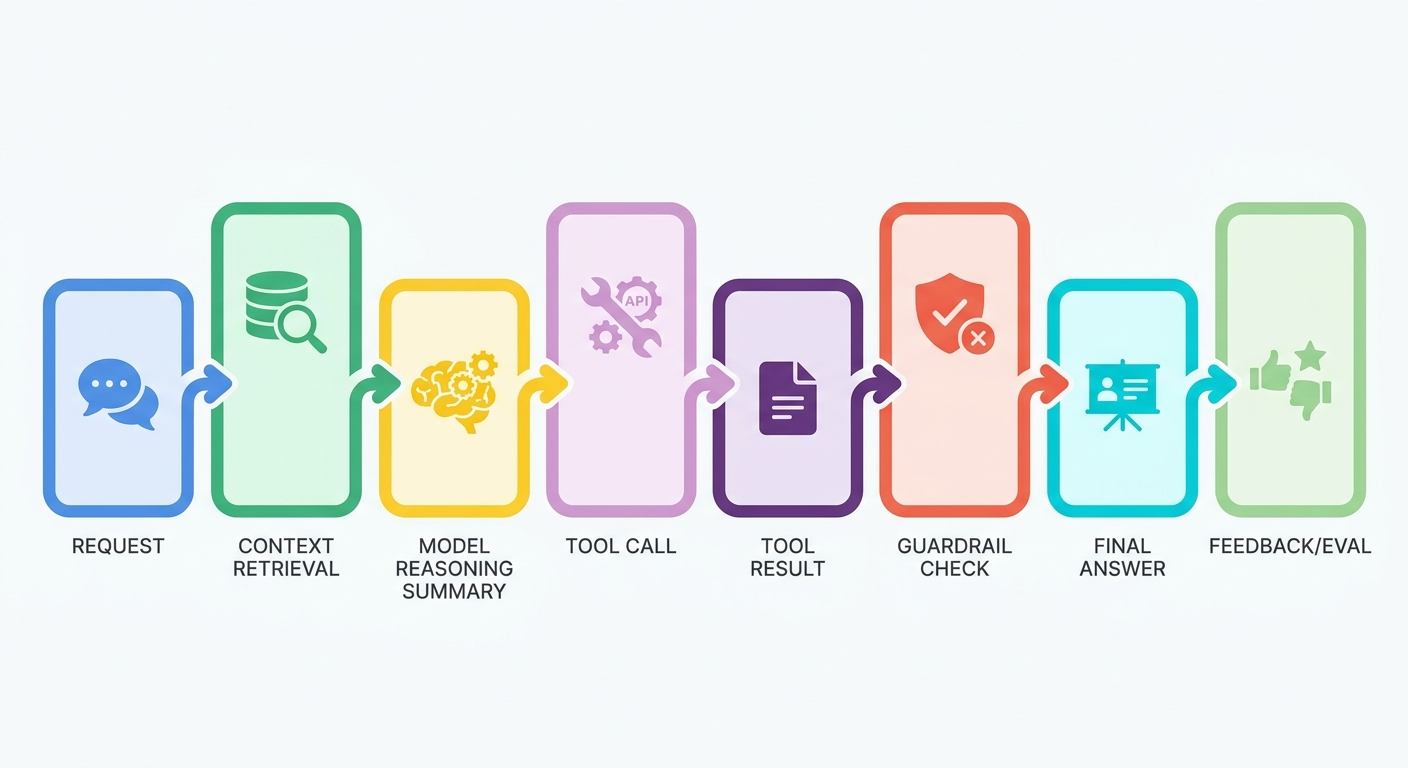
| Trace field | What to capture | Why it matters |
|---|---|---|
| Run identity | Run ID, user/session ID, agent version, environment, timestamp. | Lets you reproduce, filter, compare, and connect incidents to deployments. |
| User intent | Original request, normalized task type, risk level, expected outcome. | Helps you see which jobs the agent is actually being asked to perform. |
| Model step | Model name, prompt/template version, input summary, output summary, tokens, latency. | Identifies quality, cost, and latency changes when prompts or models change. |
| Retrieval | Query, filters, document IDs, scores, snippets, source freshness. | Shows whether the agent answered from strong evidence or weak context. |
| Tool call | Tool name, arguments, permissions, result status, response summary. | Exposes wrong-tool errors, bad arguments, flaky dependencies, and unsafe actions. |
| Guardrail | Policy check, risk classification, allow/block/escalate decision. | Turns safety from a black box into an auditable control. |
| Human review | Reviewer decision, reason, edit, approval time, escalation path. | Creates training data for when automation should pause. |
| Final result | Answer, action taken, citations, user-visible status, confidence signal. | Connects internal behavior to the outcome the user experienced. |
| Feedback and evals | User rating, human label, automated eval scores, incident tag. | Turns production data into a quality-improvement loop. |
For privacy, avoid logging raw secrets, credentials, personal data, or full private documents unless your governance model explicitly allows it. In many systems, a safe trace stores IDs, summaries, hashes, redacted snippets, and policy decisions rather than complete sensitive payloads. Observability should make systems safer, not create a second data leak.
Metrics and Evals That Actually Help
Agent teams often start with easy numbers: latency, errors, and token cost. Those are necessary, but they are not sufficient. An agent can be fast, cheap, and wrong. The useful measurement set combines operational metrics with task-quality evals and human feedback.
Automated evals are best treated as sensors, not judges with absolute authority. A code-based eval is strong for exact constraints: did the JSON validate, did the citation field exist, did the tool return success, did the answer include a required disclaimer? An LLM-as-judge eval can help score softer qualities such as helpfulness, groundedness, tone, or whether the answer addresses the question. Human review is still important for high-risk cases and for calibrating automated scores.
LangSmith’s observability docs emphasize traces, production metrics, rules, automations, and user feedback. Arize Phoenix describes a workflow where traces, evaluations, prompt experiments, and datasets work together. The shared lesson is that traces become much more valuable when they feed evals. A trace tells you what happened once. An eval tells you whether the same class of behavior is improving or getting worse across many runs.
| Failure pattern | Trace signal | Eval or metric to add |
|---|---|---|
| Hallucinated answer | Low-quality retrieval, missing citations, answer not supported by source snippets. | Groundedness eval, citation-required check, unsupported-claim label. |
| Wrong tool used | Tool choice does not match task intent or available permissions. | Tool-selection accuracy eval by task type. |
| Bad arguments | Tool was correct but arguments were malformed, too broad, or unsafe. | Schema validation, argument risk score, pre-execution approval for sensitive tools. |
| Runaway loop | Many retries, repeated tool calls, expanding context, no progress. | Retry budget, loop detector, max-cost alert, forced handoff. |
| Poor user experience | Agent answers confidently without asking a needed clarification. | Clarification-needed eval and user feedback tag. |
| Regression after prompt change | New prompt version appears in failing traces. | Versioned regression dataset and before/after comparison. |
The Production Debugging Loop: From Incident to Regression Eval
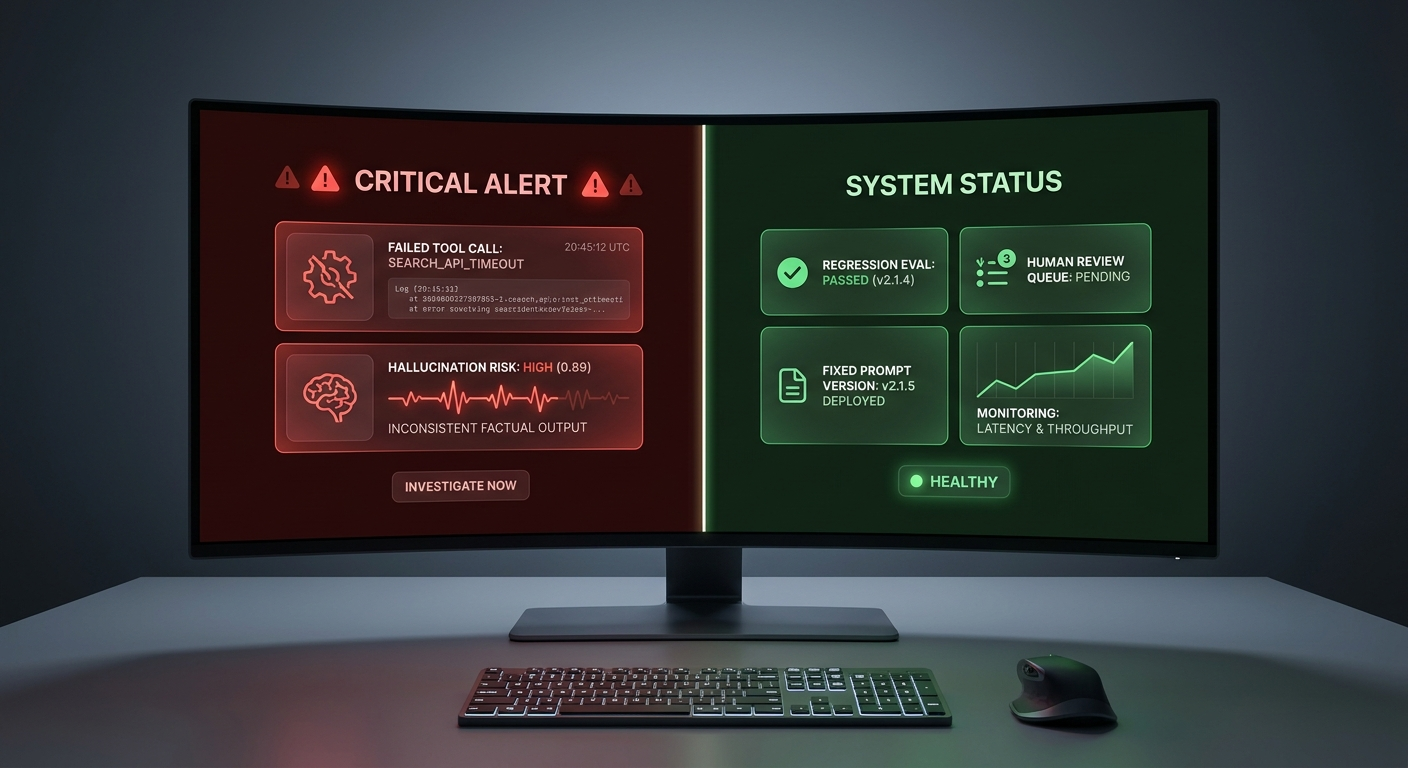
The highest-return observability habit is turning real failures into regression tests. Many teams debug an incident, patch the prompt, and move on. Then the same failure returns in a new form. A better loop is: capture the trace, label the failure, identify the weak span, create an eval, fix the system, replay similar cases, and monitor whether the metric improves.
Step 1: Start with the user-visible failure
Do not begin by blaming the model. Start with the outcome. Was the answer wrong? Was the action unsafe? Did the agent use stale context? Did it fail to call a tool? Did it call a tool without approval? Did it cost too much? A clear incident label keeps debugging focused.
Step 2: Walk backward through the trace
Look at the final answer, then the last tool result, then the guardrail decision, then retrieval, then the model call that produced the plan. Many agent bugs are upstream. The final message may be wrong because retrieval returned weak documents, a tool silently failed, or a policy check allowed a risky argument.
Step 3: Fix the smallest responsible component
If retrieval failed, adjust chunking, ranking, filters, or freshness. If the tool call was wrong, improve the tool schema, examples, validation, or approval rule. If the prompt was vague, change the instruction. If the model is underpowered for the task, route that task to a stronger model. Avoid turning every incident into a bigger system rewrite.
Step 4: Create an eval before declaring victory
Convert the incident into a test case. Include the input, expected behavior, forbidden behavior, relevant source evidence, and acceptable variations. Run it against the current version, the proposed fix, and future prompt/model versions. This is how production traces become a quality dataset instead of a pile of logs.
Step 5: Monitor the class, not only the case
One fixed incident is not enough. Track the broader class: citation failures, wrong-tool errors, unsafe approvals, high-cost loops, stale-context answers, or unresolved handoffs. Observability should show whether the product is becoming more reliable across categories, not only whether one support ticket closed.
A Practical AI Agent Observability Stack
You can build a useful stack in layers. Do not start by buying every dashboard. Start by deciding what evidence you need to answer production questions. The stack below is intentionally portable.
Minimum viable stack
- Structured logs for model calls, retrieval, tools, approvals, errors, and final output.
- Trace IDs that connect user sessions to spans across services.
- Basic dashboards for latency, errors, token cost, retries, and high-risk task volume.
- A small eval set built from real failures and important happy paths.
- A human review queue for sensitive or low-confidence actions.
Mature stack
- OpenTelemetry-compatible traces across app code, model calls, tools, and databases.
- Online evals, offline regression suites, and prompt/model experiment tracking.
- Automated alerts for safety blocks, runaway loops, cost spikes, and quality drops.
- Redaction, retention, access controls, and audit workflows for sensitive traces.
- Release gates that compare eval performance before rollout.
Tool choice depends on your architecture. LangSmith is strong for LangChain-oriented tracing, dashboards, feedback, and automations. Arize Phoenix is useful for open-source observability, evals, experiments, and OpenTelemetry/OpenInference workflows. Langfuse, Braintrust, Helicone, custom OpenTelemetry collectors, cloud-native observability platforms, and internal dashboards can also be part of the picture. The important decision is not the logo. The important decision is whether your team can answer: what happened, why, how often, how risky, and did the fix work?
For agent systems using Model Context Protocol tools, connect this guide with the Singularity Journey article on building secure MCP server tools. Tool descriptions, permissions, validation, and observability belong together. A tool that cannot be traced is a tool that cannot be trusted at production scale.
Implementation Plan: Add Observability Without Freezing Development
The easiest mistake is trying to design the perfect observability platform before the agent has real users. Start with the critical path. Pick one production workflow, such as answering support questions, updating a customer record, triaging alerts, or using an internal developer tool. Instrument that path end to end before expanding to every possible agent branch. A narrow trace that developers actually use is better than a giant telemetry plan nobody trusts.
Begin by adding a run ID at the first user interaction. Pass that ID through model calls, retrieval, tools, approval screens, background jobs, and final responses. This one habit makes later debugging dramatically easier. When someone reports a bad answer, you should not be searching through logs by timestamp and guessing which request was involved. You should be able to open the run, inspect spans, and see the exact path.
Next, version everything that can change behavior. Prompts, system instructions, model selections, retrieval indexes, tool schemas, policy rules, and routing logic should all leave version fingerprints in traces. Without versioning, regressions become blurry. With versioning, you can say: failures increased after prompt version 18, retrieval index 7, or tool schema 3. That turns opinion debates into evidence.
Then add redaction before broad sharing. Developers need enough detail to debug, but not everyone needs raw user text, private documents, credentials, or sensitive business records. Store safe summaries where possible, keep source IDs instead of full documents, and restrict sensitive trace views to approved roles. If you are unsure whether a field should be logged, treat it as sensitive until a human policy owner decides otherwise.
Finally, create a weekly review rhythm. Pick the worst traces, the most expensive traces, the most common blocked actions, and the newest user complaints. Turn a small number of them into evals. This is where observability becomes product improvement. The team is no longer collecting telemetry because dashboards look impressive; it is using real evidence to make the agent safer, cheaper, and more useful.
Common AI Agent Observability Mistakes
The first common mistake is storing prompts and responses but ignoring tools. For agents, tool calls are often where the real risk lives. A wrong answer is bad; a wrong database update, email, payment action, or deployment command can be much worse. Tool arguments, permissions, validation outcomes, and results deserve first-class spans.
The second mistake is measuring only averages. Average latency and average cost hide the agent runs that hurt users. Track percentiles, outliers, repeated retries, and high-risk categories. A rare runaway loop can matter more than a small average cost increase. A few unsafe tool attempts can matter more than thousands of harmless answers.
The third mistake is treating LLM judges as final truth. Automated judging is useful, but it can drift, miss context, and reward polished nonsense. Use LLM evals alongside code checks, source-grounding checks, human labels, and real user outcomes. The goal is not to find one perfect score. The goal is to create enough signals that failures are easier to detect and fixes are easier to verify.
The fourth mistake is separating observability from product design. If traces show that users repeatedly ask unclear questions, the solution might be a better UI, not a bigger model. If humans override the same action every day, the approval workflow may need clearer choices. If retrieval fails because documents are stale, prompt edits will not fix the root problem. Observability should influence interface design, documentation, data quality, permissions, and team process.
The fifth mistake is waiting for scale. Small agents are easier to instrument, and early traces teach you what the agent is actually doing. By the time a system has thousands of users, retrofitting telemetry can be painful. Add the simple trace now: request, retrieval, model, tool, policy, output, feedback. You can make it richer later.
Security and Governance: Observability Is a Safety Control
Observability is not only a developer convenience. It is part of AI safety and security. The OWASP GenAI Security Project tracks risks in LLM applications and agentic systems, including prompt injection, insecure outputs, excessive agency, data exposure, and vulnerable integrations. You cannot manage those risks if you cannot see when they occur.
For example, prompt injection should appear in traces as more than a scary string. You want to know which retrieved document contained the instruction, whether the guardrail detected it, whether the agent attempted a sensitive tool call afterward, and whether the action was blocked, approved, or escalated. That evidence helps security teams improve defenses and helps developers avoid false confidence.
NIST’s AI Risk Management Framework is also useful as a governance lens. It reminds teams to map, measure, manage, and govern AI risks. In practical developer terms, that means you should map which agent actions are risky, measure how often risky states occur, manage them with controls and human review, and govern the process with owners, documentation, and audit trails.
Good observability also improves accountability. If an agent updates a record, sends a message, or triggers a workflow, the trace should show who requested it, what the agent saw, which tool it used, what arguments it passed, which policy allowed it, and what result came back. That does not make the agent perfect. It makes the system reviewable.
AI Agent Observability Launch Checklist
Use this checklist before moving an agent from prototype to production. It is deliberately practical and should fit into a normal engineering review.
| Area | Launch question | Pass signal |
|---|---|---|
| Trace coverage | Can we reconstruct every important step in a failed run? | Model, retrieval, tool, guardrail, approval, final output, and feedback spans are visible. |
| Versioning | Can we compare failures across prompt, model, tool, and policy versions? | Each trace records versions and deployment identifiers. |
| Quality evals | Do we test real user tasks and known failure cases? | Regression suite includes happy paths, edge cases, and incident-derived examples. |
| Safety controls | Can risky actions be blocked, escalated, or reviewed? | Sensitive tools require validation, risk classification, and approval rules. |
| Cost controls | Can we detect loops, expensive tasks, and model overuse? | Dashboards and alerts track tokens, retries, latency, and task-level spend. |
| Privacy | Are traces safe to store and share internally? | Redaction, access control, retention, and data minimization are documented. |
| Incident loop | Does every serious failure become a learning asset? | Post-incident workflow creates labels, evals, fixes, and monitoring follow-up. |
If your team can answer these questions, you are no longer treating the agent as magic. You are treating it like a production system with unusual behavior and measurable risks. That is the mindset shift behind reliable AI development.
Keep Building Reliable Agents
- AI Agents Explained — a beginner-friendly foundation for agent planning, tools, and autonomy.
- How to Build Secure MCP Server Tools — connect tool permissions and validation with observability.
- Enterprise AI Agent Control Plane — governance patterns for teams running many agents.
- AI Guardrails Explained — how controls prevent unsafe or unreliable behavior.
- AI Risk Thresholds Explained — when stronger safeguards are needed for powerful systems.
Sources and References
- OpenTelemetry: Generative AI semantic conventions
- LangSmith Observability documentation
- Arize Phoenix documentation
- OWASP Top 10 for Large Language Model Applications / GenAI Security Project
- NIST AI Risk Management Framework
External references were included only when directly relevant and available through reputable official or project documentation pages. No shortened or unrelated links were used.
FAQ: AI Agent Observability
What is AI agent observability?
AI agent observability is the practice of tracing, measuring, evaluating, and reviewing agent behavior so teams can understand decisions, debug failures, control risk, and improve production quality.
How is agent observability different from LLM logging?
LLM logging often captures prompts and responses. Agent observability captures the full workflow: retrieval, planning, tool calls, arguments, tool results, guardrails, approvals, retries, final output, feedback, and eval scores.
What should an AI agent trace include?
A useful trace includes run identity, user intent, model calls, prompt version, retrieved context, tool calls, guardrail decisions, human review, latency, token usage, errors, final answer, and evaluation results.
Do small AI agents need observability?
Yes, but the setup can be lightweight. If an agent only answers low-risk questions, structured logs and a few evals may be enough. If it uses tools or private data, tracing and review become much more important.
Which metrics matter most for production AI agents?
Track latency, error rate, retries, token cost, tool failures, goal completion, groundedness, citation quality, user feedback, safety blocks, and regression eval performance.
How do traces become evals?
When a production run succeeds or fails in an important way, save the input, expected behavior, source evidence, and failure label. Add it to a regression dataset and test future prompt, model, or tool changes against it.
Can OpenTelemetry be used for AI agent observability?
Yes. OpenTelemetry and GenAI semantic convention work can help standardize traces across model calls, agent spans, tools, and traditional application services.
How does observability improve AI safety?
It makes risky behavior visible. Teams can detect prompt injection, unsafe tool attempts, excessive autonomy, missing approvals, weak retrieval, and policy failures before they become repeated incidents.
