
AI Agent Debugging Runbook: Triage Tool, Context, Memory, and Latency Failures
Production AI agents rarely fail in one neat way. This runbook shows how to move from a user-visible incident to traces, failure classification, root cause, regression evals, and monitoring without turning every bug into a vague prompt-engineering debate.
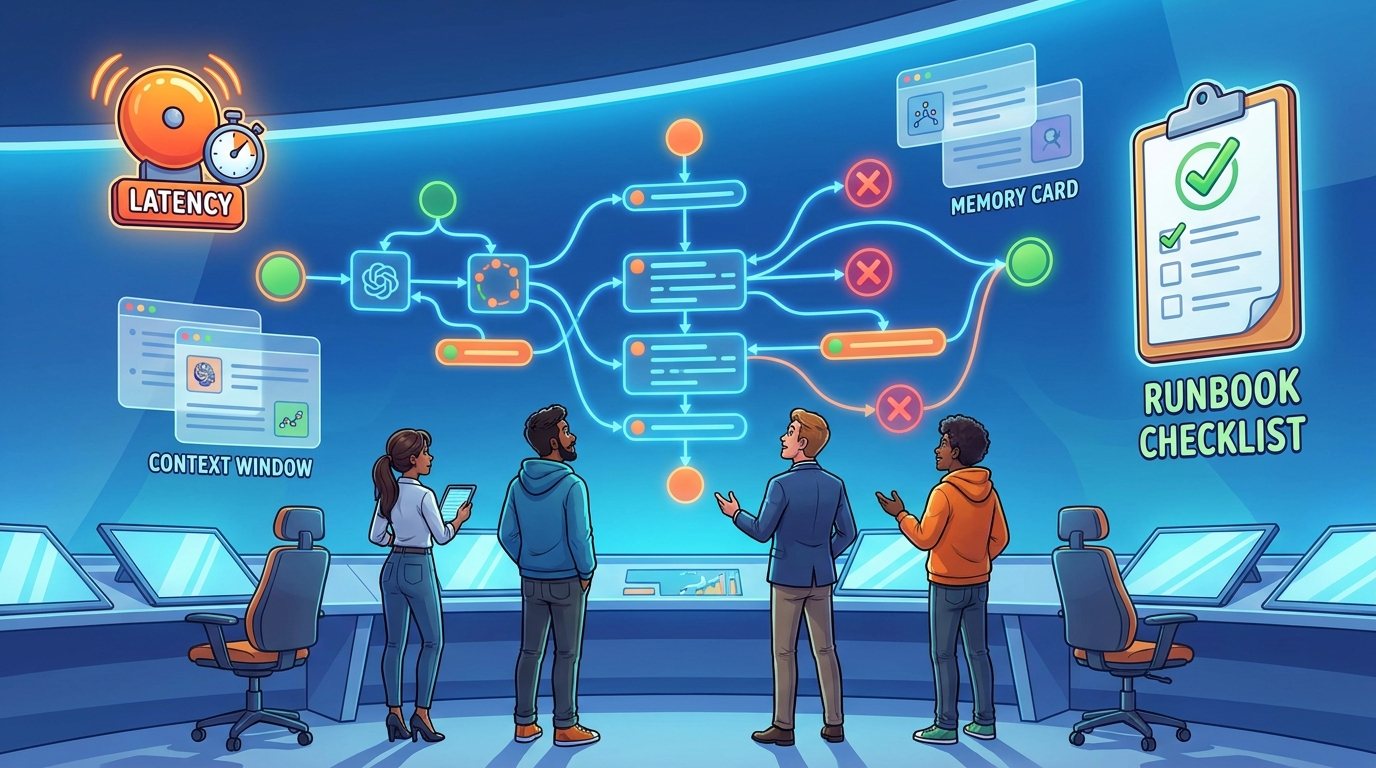
AI Agent Debugging Runbook: Quick Answer
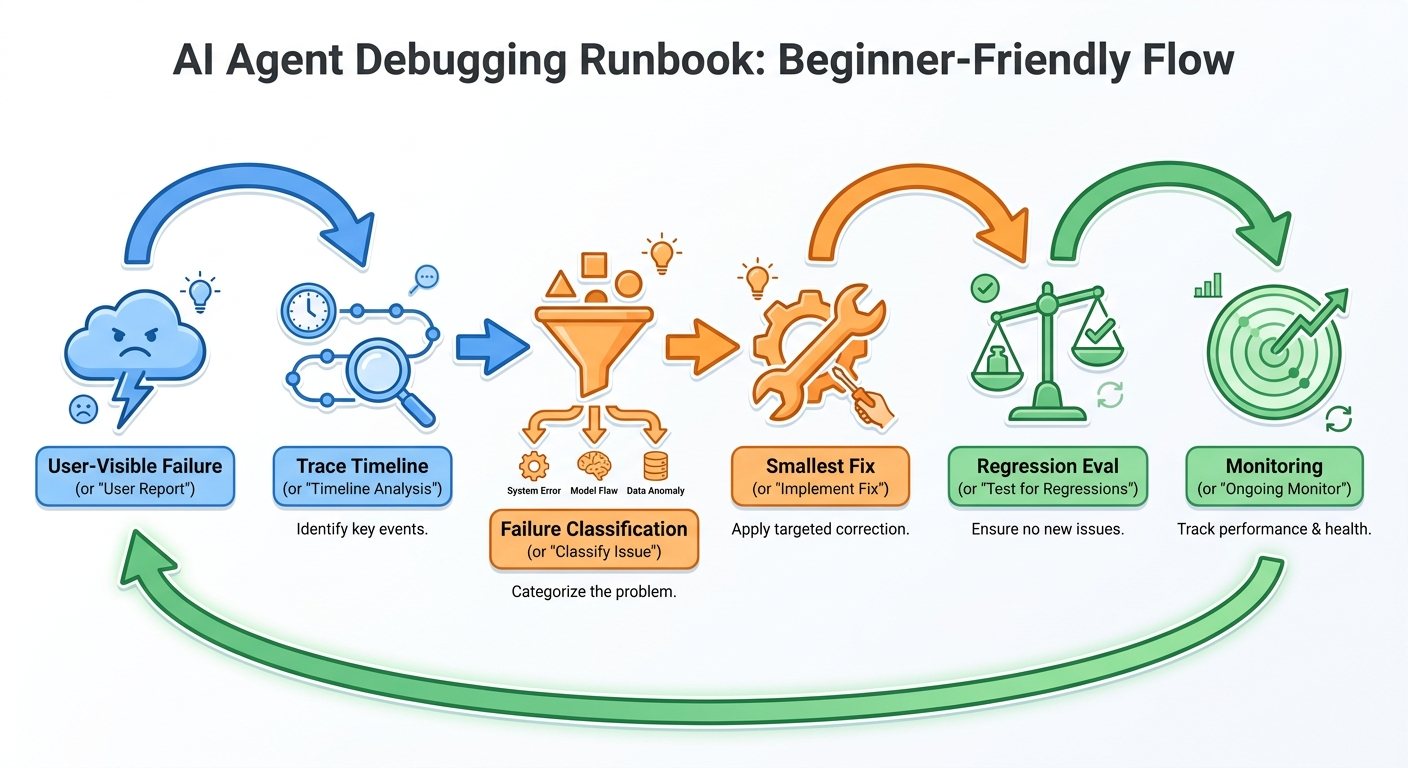
An AI agent debugging runbook is a repeatable incident workflow for finding why an agent gave the wrong answer, selected the wrong tool, used bad context, remembered the wrong fact, ran too slowly, spent too much, or failed a handoff. It turns production debugging into a sequence: capture the failed interaction, inspect the trace, classify the failure, fix the smallest responsible component, add a regression eval, and monitor whether that failure class returns.
The most useful runbook starts with the user-visible symptom, not the model provider. “The agent hallucinated” is usually too broad to be actionable. A better first sentence is: “The refund agent told a customer they were eligible for a refund because it retrieved an outdated policy page and skipped the eligibility tool after a malformed schema response.” That sentence tells the team where to look: retrieval, tool result parsing, decision policy, and regression coverage.
This article is a cluster guide for the pillar article AI Agent Observability: How to Trace, Evaluate, and Debug Production Agents. The pillar explains the full observability system. This page goes narrower: the practical debugging runbook your team can use during incidents and postmortems.
Why Production AI Agents Need a Debugging Runbook
Traditional web apps usually fail in familiar categories: exceptions, bad deployments, database errors, slow dependencies, authorization mistakes, and confusing user interface states. Agents include those problems, but add a probabilistic decision layer. The same user goal can lead to different planning paths, tool calls, retrieved documents, prompts, memory entries, and final responses. That makes production debugging more slippery unless the team agrees on a repeatable investigation path.
A runbook matters because agent incidents often attract the wrong first reaction. Developers may immediately rewrite the system prompt. Product managers may blame the model. Security reviewers may blame prompt injection. Operations teams may focus only on latency. Sometimes one of those is correct, but a trace-first runbook prevents premature fixes. It asks: what did the agent see, what did it decide, what tool or memory did it rely on, what changed recently, and what evidence proves the fix works?
Modern observability tools are moving in this direction. LangSmith describes observability as visibility from traces to production-wide performance metrics, with tools to investigate traces, monitor performance, collect feedback, and configure online evaluations. Arize Phoenix describes LLM tracing as a way to capture the sequence of operations in an LLM application, including retrieval, embedding generation, language model invocation, response generation, token usage, exceptions, tool descriptions, and function calls. OpenTelemetry’s GenAI semantic convention work is also pushing the ecosystem toward more consistent span and event names. The direction is clear: production agents need structured evidence, not screenshots and guesswork.
The runbook also protects teams from overfitting. If you fix a single bad answer by adding a very specific line to the prompt, you may make today’s trace look better while making tomorrow’s cases worse. A strong runbook converts incidents into regression datasets and monitors the class of failure, not only the individual ticket.
The AI Agent Failure Map
Before triage, agree on the categories. A shared failure map saves time because the team can label traces consistently across engineering, product, support, and safety review. The categories below are intentionally practical. They are not a complete research taxonomy; they are the labels most teams need when debugging agents that use tools, retrieval, memory, and human approval.
The same incident can include multiple categories. A support agent might retrieve an old policy, call the refund API with missing fields, and then produce a confident answer. Do not force one label too early. During initial triage, mark primary and contributing failures. During the postmortem, decide which category receives the permanent fix and which categories need monitoring.
| Symptom | Likely evidence to inspect | Common fix | Regression eval |
|---|---|---|---|
| Wrong tool selected | Planner span, available tool list, tool descriptions, arguments, prior examples | Clarify tool boundaries, tighten schemas, add tool-selection examples | Cases where similar tools compete |
| Correct tool, bad arguments | Function call payload, schema validation result, user input extraction | Validation, argument repair, required fields, confirmation step | Malformed, missing, and ambiguous input cases |
| Bad answer from retrieved context | Retrieved chunks, scores, source freshness, prompt placement | Improve retrieval filters, chunking, ranking, freshness, citations | Known-answer retrieval set |
| Memory leaked or outdated | Memory write/read trace, tenant ID, timestamps, deletion rules | Memory scope, expiry, user confirmation, audit trail | Cross-user, outdated, and conflict cases |
| Too slow or costly | Span durations, token counts, retries, model choice, queue time | Budget gates, caching, smaller context, parallelism, fallback model | Latency and cost threshold test |
The Production Triage Loop
The runbook works best as a loop, not a one-time checklist. Each incident should make the next incident easier to handle. The loop has six steps: preserve the failed interaction, reconstruct the path, classify the failure, isolate the smallest fix, prove the fix with an eval, and add a monitor or alert. Skipping the final two steps is why many teams keep seeing the same agent bug under different names.
Step 1: Preserve the failed interaction
Capture the user input, final answer, timestamp, session ID, agent version, model, prompt version, tool versions, retrieval index version, memory state, environment, and any human reviewer notes. If privacy rules prevent storing raw content, store redacted fields and enough metadata to reproduce the issue safely. Do not rely on a screenshot pasted into Slack. A screenshot may show the answer, but it rarely shows the tool result, prompt, retrieved chunk, or memory that caused the answer.
Step 2: Reconstruct the trace from outside in
Start with the final user-visible failure and walk backward through the trace. Which response span generated the final answer? Which messages and tool results were visible at that point? Which planning step preceded the response? Which retrieval call selected the supporting documents? Which memory read modified the context? Which previous turn changed the state? This outside-in approach keeps the investigation anchored to the actual user harm.
Step 3: Label the failure class
Use labels such as tool selection, tool argument, retrieval miss, stale context, bad memory, policy bypass, planner loop, low-confidence output, latency spike, cost spike, or human-handoff failure. If the team cannot label the issue, that is useful information: the runbook needs a new category or better trace data.
Step 4: Fix the smallest responsible component
Small fixes are easier to evaluate. If the tool schema is ambiguous, fix the schema before rewriting the whole agent. If retrieval returned outdated content, fix freshness and filters before changing the model. If the model skipped human approval, strengthen the approval gate in code rather than trusting a longer reminder in the prompt. Prompts are part of the system, but they should not be the only enforcement layer.
Step 5: Turn the incident into a regression eval
A production failure is a gift if it becomes a test case. Add the failed input, expected behavior, forbidden behavior, relevant context, and scoring criteria to an offline evaluation dataset. LangSmith’s evaluation workflow, for example, supports offline evaluation before shipping and online evaluation on production interactions. The tool is less important than the habit: every serious incident should leave behind a reusable example.
Step 6: Monitor the failure class
Do not only ask whether the exact incident is fixed. Ask whether the same class is trending down. Monitor tool-call validation errors, retrieval no-hit rates, memory conflict rates, approval bypass attempts, latency by step, cost per successful task, and human reviewer disagreement. Agent reliability improves when teams can see classes of failure before they turn into customer incidents.
Debugging Tool-Call Failures
Tool-call failures are often the easiest to prove because they leave concrete artifacts: selected tool name, arguments, schema validation, API response, exception, retry behavior, and final interpretation. Start by asking whether the tool should have been available for this task. If not, the problem is permissions or routing. If yes, ask whether the agent selected the correct tool. If it selected the correct tool, inspect the arguments. If the arguments were valid, inspect the tool response and how the model interpreted it.
Tool descriptions deserve special attention. Many agents fail because two tools sound similar, because a tool description hides important constraints, or because a schema accepts optional fields that are actually required for safe action. A human can infer the missing rule; the agent may not. Clear descriptions, strict schemas, validation errors, and repair loops make tool use more predictable.
For high-risk actions, the fix should usually live outside the prompt. A payment, deletion, permission change, outbound message, or account update should have code-level authorization, confirmation, and audit logging. OWASP’s prompt injection guidance is a useful reminder that untrusted inputs can alter model behavior in unintended ways. If a tool can cause real-world harm, do not depend on the model to remember every safety rule from the system prompt.
| Tool problem | Trace clue | Safer fix |
|---|---|---|
| Wrong tool | Planner picked a tool whose description overlaps with the correct one | Rename tools, add negative examples, separate tool groups by task |
| Missing required field | Validation error or downstream API rejection | Make field required, ask user for clarification, add preflight validation |
| Dangerous retry | Repeated calls after partial success or timeout | Idempotency keys, retry budget, status check before retry |
| Bad result interpretation | Tool returned an error or empty result but final answer ignored it | Structured result contract, error handling policy, answer gate |
Debugging Context and Memory Failures
Context failures happen when the agent does not have the right information at the right moment. Memory failures happen when the agent has stored information but applies it incorrectly. They are related, but the fix is different. Retrieval and prompt assembly problems usually require changes to indexing, ranking, chunking, filters, citations, or prompt placement. Memory problems require scope, expiration, consent, conflict resolution, and auditability.
For retrieval, inspect the exact documents or chunks placed in the prompt. Were they relevant? Were they current? Were they from the right tenant, product, region, or policy version? Did the model cite them or merely absorb them? A surprising number of “model quality” incidents are actually source-selection incidents. If the answer depended on an outdated page, the model may have behaved rationally given bad evidence.
For memory, ask four questions. Who owns this memory? When was it written? What evidence supports it? When should it expire or be refreshed? A preference such as “use concise answers” is low risk. A fact such as “the customer is on the enterprise plan” is time-sensitive and should probably come from an authoritative tool, not long-term conversational memory. Cross-user or cross-tenant memory bugs are severe because they can become privacy incidents.
Agent memory should also be visible to operators. If a trace shows only the final prompt but not the memory read, the team cannot confidently debug the behavior. Add spans or metadata for memory writes, reads, updates, deletions, and conflict decisions. When possible, keep a human-readable reason for why a memory was used.
Good context debugging habits
- Store retrieval query, returned chunks, scores, filters, and source timestamps.
- Separate user content, system instructions, retrieved documents, and tool results in traces.
- Create golden test cases for known-answer questions.
- Alert on retrieval no-hit, stale-source, and low-confidence patterns.
Risky context debugging habits
- Blaming the model without checking what evidence it saw.
- Putting everything into the prompt and hoping more context means better context.
- Using long-term memory for authoritative facts that should come from tools.
- Fixing one case with a brittle prompt exception instead of improving retrieval.
Debugging Latency, Cost, and Runtime Failures
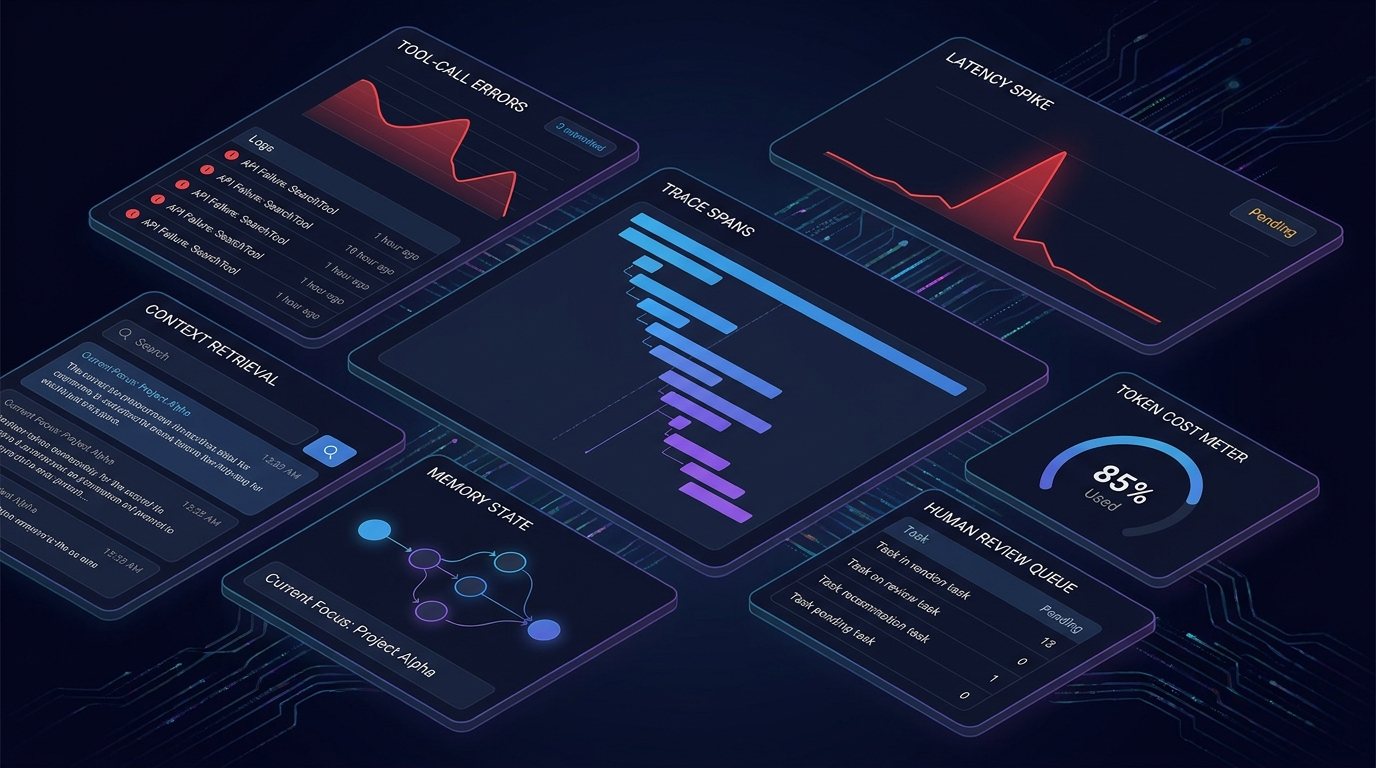
Agent reliability is not only correctness. A correct answer that arrives too late, costs too much, or times out under load can still fail the product. Runtime debugging needs span-level timing, model latency, token counts, tool durations, retry counts, queue time, cache hit rate, and final task success. Arize Phoenix notes that LLM tracing can expose application latency, token usage, runtime exceptions, retrieved documents, parameters, prompt templates, and function calls. Those fields are exactly what a runbook needs.
Start by separating wait time from work time. Did the agent spend time waiting in a queue, waiting for a slow tool, generating a long response, retrying after rate limits, or processing oversized context? Then ask whether the slow step improved task success. Some expensive reasoning steps are worth it for hard tasks. Others are leftovers from a generic agent architecture that does too much for simple requests.
Cost debugging follows a similar pattern. Track cost per successful task, not only total spend. If a multi-step agent costs more but resolves complex cases with fewer human escalations, the spend may be justified. If token cost rises because the prompt includes irrelevant conversation history, the fix is context pruning. If retries dominate cost, the fix may be idempotency, circuit breakers, clearer tool errors, or fallback routing.
Use budget gates for open-ended tasks. An agent should know when it is allowed to continue, when it must summarize progress, and when it must ask for human approval. Anthropic’s guidance on building effective agents emphasizes simple, composable patterns and warns that agentic systems often trade latency and cost for better task performance. That tradeoff is acceptable only when the task justifies it and the runbook makes the tradeoff visible.
AI Agent Debugging Checklist
Use this checklist during the incident and again during the postmortem. The first pass should be fast. The second pass should improve the system.
| Checkpoint | Question to answer | Done when |
|---|---|---|
| Evidence preserved | Can we reconstruct the failed path without relying on memory or screenshots? | Trace, prompt version, model, tool versions, retrieval, memory, and output are captured or safely redacted. |
| Failure classified | What primary and secondary failure classes explain the incident? | Labels are attached to the trace and postmortem. |
| Responsible component isolated | Which component produced the wrong condition? | The team can point to a tool, context, memory, policy, planner, model, or runtime issue. |
| Smallest fix chosen | What is the smallest safe change that addresses the root cause? | The fix avoids broad prompt rewrites unless prompt behavior is truly the root cause. |
| Regression eval added | Can we catch this class before it returns? | A test case, evaluator, or review rubric exists. |
| Monitor added | Will the team see recurrence before users complain? | A metric, alert, dashboard, or review queue tracks the class. |
For teams just starting, the minimum viable runbook is simple: collect traces for every production interaction, sample failures for human review, maintain a failure taxonomy, turn serious failures into evals, and review the top failure classes every week. A mature team can add automated online evaluators, anomaly detection, per-tool reliability dashboards, cost budgets, incident severity levels, and release gates based on evaluation results.
What to include in the incident note
A useful incident note should be short enough to write during pressure and structured enough to search later. Include the user-visible symptom, severity, trace link, affected agent version, model version, prompt version, tools involved, retrieval sources, memory reads, policy gates, root-cause hypothesis, immediate mitigation, permanent fix owner, and the regression eval that will prevent the same pattern from returning. If the incident involved a user-facing answer, copy the expected answer style and the forbidden answer style. If it involved an action, document whether the action was blocked, reversed, approved, or escalated.
The note should also separate evidence from interpretation. Evidence is “the agent called refund_lookup with an empty order_id and the tool returned validation_error.” Interpretation is “the extraction prompt made the agent overconfident when the user wrote the order number in a screenshot.” Both are valuable, but mixing them too early can hide better explanations. During the first hour, preserve facts. During the postmortem, decide what those facts mean.
How often to review the runbook
Review the runbook after every high-severity incident and at least once per month for active production agents. Remove categories nobody uses. Add categories that keep appearing in support tickets. Retire metrics that never influence a decision. Promote manual review checks into automated evaluators when the pattern is stable. A runbook is not documentation for documentation’s sake; it is operational memory. If the team cannot use it during a real incident, simplify it.
Finally, make the runbook visible to more than the ML or platform team. Support needs the symptom language. Product needs the user-impact categories. Security needs the approval and audit trail. Engineering needs the trace and fix path. The best AI agent debugging culture is cross-functional because agent failures are rarely only model failures.
Internal linking also matters for topical authority and reader flow. If you need the broader observability architecture, start with AI Agent Observability. If your main gap is instrumentation, read OpenTelemetry for AI Agent Tracing. If your issue is quality measurement, read AI Agent Evaluation Metrics. This runbook connects those pieces into the incident workflow.
Sources and References
- Singularity Journey: AI Agent Observability
- LangSmith Observability documentation
- LangSmith Evaluation documentation
- Arize Phoenix LLM tracing documentation
- OpenTelemetry GenAI semantic conventions page
- OpenTelemetry semantic-conventions-genai repository
- OWASP GenAI Security Project: Prompt Injection
- Anthropic: Building Effective Agents
Tooling, model behavior, and observability conventions change quickly. Validate implementation details against your current framework, provider, security requirements, and production data-retention policy.
FAQ: AI Agent Debugging Runbooks
What is an AI agent debugging runbook?
It is a repeatable workflow for investigating production agent failures. It preserves the failed interaction, inspects traces, classifies the failure, isolates the responsible component, adds a regression eval, and monitors recurrence.
What should I inspect first when an AI agent gives a wrong answer?
Start with the final response trace and walk backward. Inspect the model input, tool results, retrieved context, memory reads, planner decisions, prompt version, and any policy or approval gates involved.
How is debugging an AI agent different from debugging a chatbot?
Agents can plan, call tools, use memory, retrieve documents, and take actions. That means failures can come from orchestration, tool schemas, permissions, context, memory, runtime dependencies, or model behavior, not only from the final prompt.
Should I fix agent bugs by changing the system prompt?
Sometimes, but not always. If the problem is ambiguous instruction or tool choice, a prompt change may help. If the issue is authorization, schema validation, stale retrieval, memory scope, or approval, the safer fix is usually code, data, or policy enforcement.
What metrics help debug AI agent incidents?
Useful metrics include task success rate, tool-call error rate, schema validation failure rate, retrieval no-hit rate, stale-source rate, memory conflict rate, human reviewer disagreement, latency by span, token cost, retries, and escalation rate.
How do traces help with agent debugging?
Traces show the sequence of steps behind an interaction: prompts, model calls, retrieved documents, tool calls, tool results, exceptions, retries, memory reads, and final output. They turn a vague complaint into inspectable evidence.
What is the best regression test for an agent failure?
The best regression test captures the failed user goal, expected behavior, prohibited behavior, relevant context, and scoring criteria. It should test the failure class, not only one exact wording of the original prompt.
How do I debug an agent that is too slow?
Break down latency by trace span. Separate model time, tool time, retrieval time, queue time, retries, and output length. Then decide whether each expensive step improves task success enough to justify its cost.
