
OpenTelemetry for AI Agent Tracing: A Practical Trace Design Guide
A focused guide for developers who already know that production agents need observability, but now need a concrete trace design: what spans to create, what attributes to record, what to redact, and how to turn traces into evals instead of endless dashboard noise.
Quick Answer: What Should an AI Agent Trace Show?
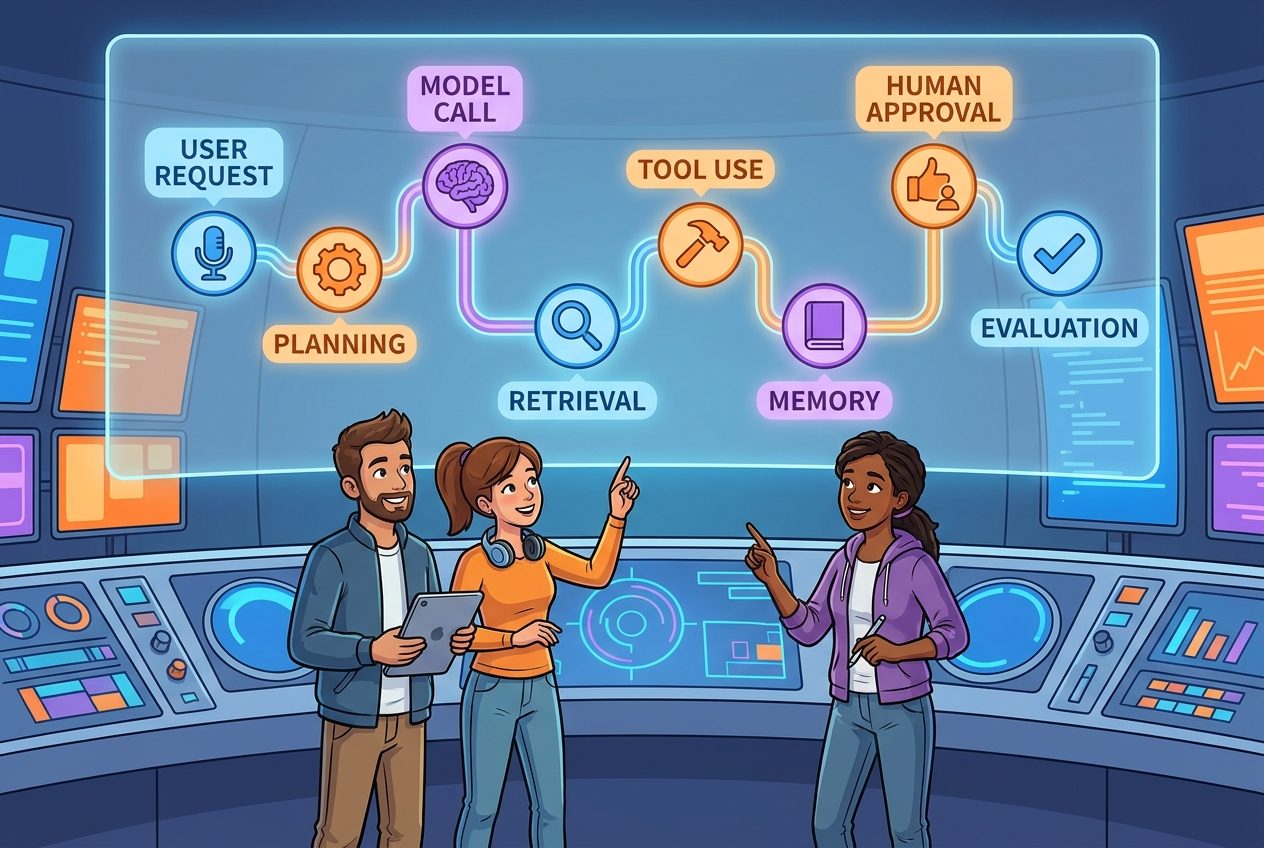
OpenTelemetry for AI agent tracing should show the full path from a user request to the final answer or action: the agent plan, model calls, tool calls, retrieval steps, memory reads and writes, approval gates, retries, errors, token usage, latency, cost signals, and evaluation results. A useful trace does not only say that the agent was slow or wrong. It shows where the workflow became slow, risky, expensive, or incorrect.
The narrow job of this cluster article is trace design. The broader pillar article, AI Agent Observability: How to Trace, Evaluate, and Debug Production Agents, explains the whole observability system: traces, metrics, logs, evals, incident debugging, dashboards, and governance. This guide zooms into one supporting question: if you instrument an agent with OpenTelemetry-style spans, what should the trace actually contain?
The practical trace should answer seven questions. What did the user ask? What plan did the agent form? Which model calls happened? Which tools were called, with what safe metadata? Which context was retrieved or remembered? Where did latency and cost accumulate? Which guardrail, human approval, or eval decided whether the result was acceptable?
This matters because normal web observability usually starts with services, endpoints, databases, queues, and infrastructure. AI agents add a second layer: reasoning steps, prompt context, tool choices, non-deterministic outputs, user feedback, and quality checks. If that layer is invisible, a production incident becomes guesswork.
Why Use OpenTelemetry for AI Agent Tracing?
OpenTelemetry is useful because it gives teams a common language for traces, metrics, logs, context propagation, and backend portability. You can send telemetry to many observability systems instead of locking every trace decision inside a single vendor UI. For AI agents, the strongest argument is not fashion. It is operational discipline. Agents often cross application code, LLM providers, vector stores, tool servers, queues, approval systems, and product workflows. A trace standard helps those pieces describe one run consistently.
The OpenTelemetry project has been expanding GenAI semantic conventions, and its older documentation now points readers to a dedicated GenAI semantic conventions repository. That movement is a signal: LLM and agent telemetry is becoming a first-class observability problem, not a side note. The exact conventions may evolve, so developers should avoid hard-coding fragile assumptions. But the shape is clear: model requests, responses, usage, system, operation names, errors, and agent spans need consistent fields.
Specialized platforms such as LangSmith and Arize Phoenix show the same pattern from the product side. LangSmith emphasizes traces, production metrics, rules, feedback, and monitoring. Phoenix describes traces that capture model calls, retrieval, tool use, and custom logic, then combines tracing with evaluations and experiments. The best production architecture can use these tools while still keeping a vendor-neutral instrumentation mindset.
For a small team, OpenTelemetry also creates a healthy boundary between application code and observability tooling. Your code emits spans and attributes. Your chosen backend displays them, filters them, samples them, scores them, and alerts on them. If the backend changes later, the agent does not need a full rewrite.
| Need | Traditional app tracing | AI agent tracing |
|---|---|---|
| Root unit | HTTP request, job, or transaction | Agent run or user task |
| Main uncertainty | Service failure, latency, saturation | Bad reasoning, bad context, unsafe tool use, hallucinated output |
| Important children | DB query, cache call, API request | Plan step, model call, retrieval, tool call, memory operation, approval gate |
| Quality signal | Status code, error rate, SLO | Task success, groundedness, tool correctness, policy outcome, human feedback |
| Risk | Leaking logs, noisy dashboards | Leaking prompts, PII, secrets, customer data, unsafe actions |
The Trace Model: One Agent Run, Many Explaining Spans
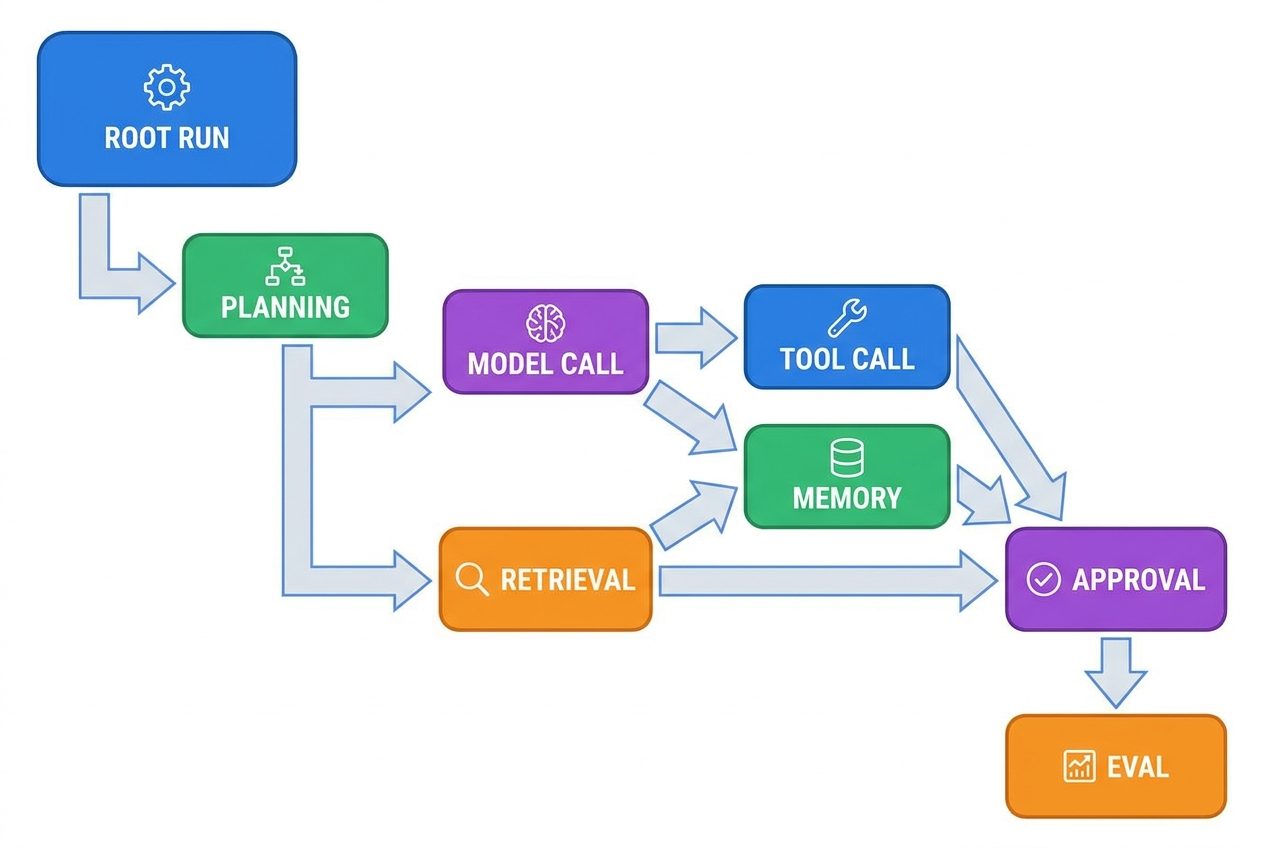
The cleanest model is simple: one user-visible agent run becomes one trace. The root span represents the task lifecycle, from request accepted to final response or action completed. Child spans represent the work the agent performed. This lets a developer open one trace and see the causal chain without searching through disconnected logs.
The root span should carry safe summary metadata: product surface, tenant or workspace identifier if privacy-safe, agent name, agent version, workflow type, environment, release SHA, and final outcome. It should not store raw private prompts by default. A sanitized request category is often enough for routine observability. For example, “refund workflow,” “internal support search,” “code migration helper,” or “sales proposal assistant” gives context without exposing sensitive text.
Inside the root span, create child spans for the major operations. A planning span records that the agent created or updated a plan. A model span records the LLM call metadata. A retrieval span records the search query class, index name, top-k value, and whether a relevant document was found. A tool span records the tool name, permission scope, status, latency, and safe result category. A memory span records whether memory was read, written, or skipped. An approval span records whether a human or policy gate allowed the action. An eval span records the score or pass/fail result.
The important design choice is granularity. Do not create a span for every tiny string operation. Do create spans for steps that explain cost, latency, risk, quality, or user-visible behavior. If a future incident review would ask “what happened here?”, that step deserves trace visibility.
A Practical Span Map for Production Agents
A span map is the blueprint your team agrees to before instrumenting. Without one, each developer invents their own span names and attributes. The first week feels productive, but the dashboard becomes unusable. A good span map makes traces comparable across releases, teams, and agent workflows.
1. Agent run span
Name the root span after the workflow, not after a random user prompt. Examples: agent.run.customer_support, agent.run.research_assistant, or agent.run.code_review. Add attributes for agent version, workflow version, environment, release SHA, user segment, and outcome. The outcome should be a controlled vocabulary such as success, partial_success, blocked_by_policy, needs_human, tool_failure, or model_failure.
2. Planning span
Agents often fail before they call a tool. They misunderstand the task, skip a constraint, or choose the wrong plan. A planning span should capture the plan type, number of steps, whether the plan was revised, whether policy affected the plan, and whether the user or system required approval. Keep the raw plan optional and access-controlled. A sanitized plan summary is safer for normal dashboards.
3. Model call span
Model spans should include provider, model, operation type, request token count, response token count, total token count, latency, temperature or decoding class when relevant, finish reason, cache status if available, and retry count. Record prompt template version and system instruction version instead of dumping the entire prompt. If you need raw prompts for debugging, store them in a restricted trace attachment with retention limits and redaction.
4. Retrieval span
Retrieval is one of the most common hidden failure points. The agent may answer poorly because the model is weak, but it may also answer poorly because the retrieval query was vague, the vector index was stale, filters were wrong, or the top documents were irrelevant. Capture the index name, retrieval strategy, top-k, filters, hit count, chosen document IDs or hashes, and a lightweight relevance outcome.
5. Tool call span
Tool spans are where observability meets safety. Capture tool name, tool version, permission scope, side-effect category, approval state, latency, timeout, status, error class, and sanitized result type. Avoid recording secrets, credentials, raw customer records, or full API payloads unless a separate secure logging policy allows it. For write actions, include whether the tool was dry-run, approved, executed, rolled back, or blocked.
6. Memory span
Memory is powerful and dangerous because it creates continuity. Capture the memory namespace, operation, freshness, confidence, source type, and consent category. Avoid putting sensitive memory content directly in spans. If the agent used memory to make a decision, the trace should show that memory influenced the run, but normal observability views do not need the full memory text.
7. Approval and guardrail span
Every high-risk agent should show approval decisions. Was the action automatically allowed by policy? Did a human approve it? Was it blocked because of missing scope? Was it escalated? This span becomes essential evidence when a user asks why the agent did or did not perform an action.
8. Evaluation span
Traces become much more useful when evals attach to them. Add spans or events for groundedness checks, policy checks, task success checks, user feedback, human review, and regression-suite membership. This connects single-run debugging to systematic quality improvement.
Attributes Worth Recording: The Minimum Useful Schema
The goal is not to capture everything. The goal is to capture enough structured data that your team can filter, compare, and investigate. If every attribute is free text, dashboards become weak. If every payload is raw, privacy risk rises. Use stable names, controlled values, and clear data-retention rules.
| Area | Attributes to capture | Why it matters |
|---|---|---|
| Agent identity | Agent name, agent version, workflow version, release SHA, environment | Separates model issues from release or prompt-template regressions. |
| Run outcome | Status, final outcome, failure class, retry count, user-visible severity | Lets teams group incidents and calculate task success rates. |
| Model usage | Provider, model, operation, token counts, latency, finish reason | Explains cost, speed, truncation, and provider-specific failures. |
| Tool usage | Tool name, version, scope, side-effect class, approval state, error class | Shows whether the agent failed because of tools, permissions, or unsafe actions. |
| Retrieval | Index, strategy, top-k, filter class, hit count, selected doc IDs or hashes | Reveals stale indexes, poor search, missing knowledge, and irrelevant context. |
| Memory | Namespace, operation, confidence, age, consent category | Helps debug stale or inappropriate memory without leaking raw memory. |
| Evaluation | Eval name, version, score, threshold, pass/fail, reviewer type | Turns traces into regression evidence and quality trend data. |
Use a small taxonomy for failure classes. For example: bad_context, tool_error, permission_denied, policy_block, model_refusal, hallucinated_fact, timeout, rate_limit, format_error, human_rejected, and unknown. The taxonomy will never be perfect, but it is better than a pile of exception messages.
Also track “near misses.” A near miss is a run that succeeded only because a guardrail, approval gate, retry, or human edit caught a problem. Near misses are gold for improving agent reliability. If your dashboard only tracks final failures, it will miss the warning signs before a bigger incident.
Privacy, Security, and Redaction Rules for Agent Traces
AI traces can become more sensitive than ordinary logs because prompts may contain customer data, business plans, source code, secrets, support tickets, internal policies, and user intent. Treat agent traces as regulated operational data, not harmless debugging screenshots.
Start with a default-deny rule for raw content. Record prompt template identifiers, content categories, hashes, document IDs, token counts, and sanitized summaries before recording full text. If full prompt or response capture is necessary, put it behind explicit configuration, strict access control, short retention, redaction, and audit logging. Developers should not need broad access to raw user data to debug most latency, cost, routing, or tool errors.
OWASP’s GenAI security work is a useful reminder that agentic AI systems introduce risks beyond simple text generation. Tool misuse, sensitive information disclosure, excessive agency, indirect prompt injection, and supply-chain-style weaknesses can all appear inside agent workflows. A trace should therefore show safety-relevant control decisions, but it should not create a new data leak by storing everything the agent saw.
Good trace hygiene
- Store stable identifiers instead of raw payloads where possible.
- Redact secrets, credentials, tokens, and personal data before export.
- Use role-based access for raw traces and attachments.
- Set retention by sensitivity and environment.
- Audit who opened sensitive traces during incidents.
Risky trace habits
- Logging every prompt and response by default.
- Sending raw customer records to third-party dashboards without review.
- Mixing production and development telemetry carelessly.
- Keeping trace data forever because storage is cheap.
- Using free-text attributes that hide secrets in unexpected fields.
The safer approach is layered visibility. Most dashboards show metadata and scores. Incident responders can request deeper trace content when needed. Security and compliance teams define which fields are forbidden, which are masked, and which require a special access path.
Connect Traces to Evals, Not Just Dashboards
Tracing tells you what happened. Evals tell you whether it was acceptable. Production AI agents need both. Without traces, eval failures are hard to explain. Without evals, traces become interesting but unactionable.
For each important agent workflow, attach at least one quality signal to the trace. A customer support agent may need groundedness, policy compliance, and resolution outcome. A code assistant may need test result, diff risk, and reviewer acceptance. A research agent may need citation coverage and contradiction checks. A data-entry agent may need schema validity, tool success, and human rejection rate.
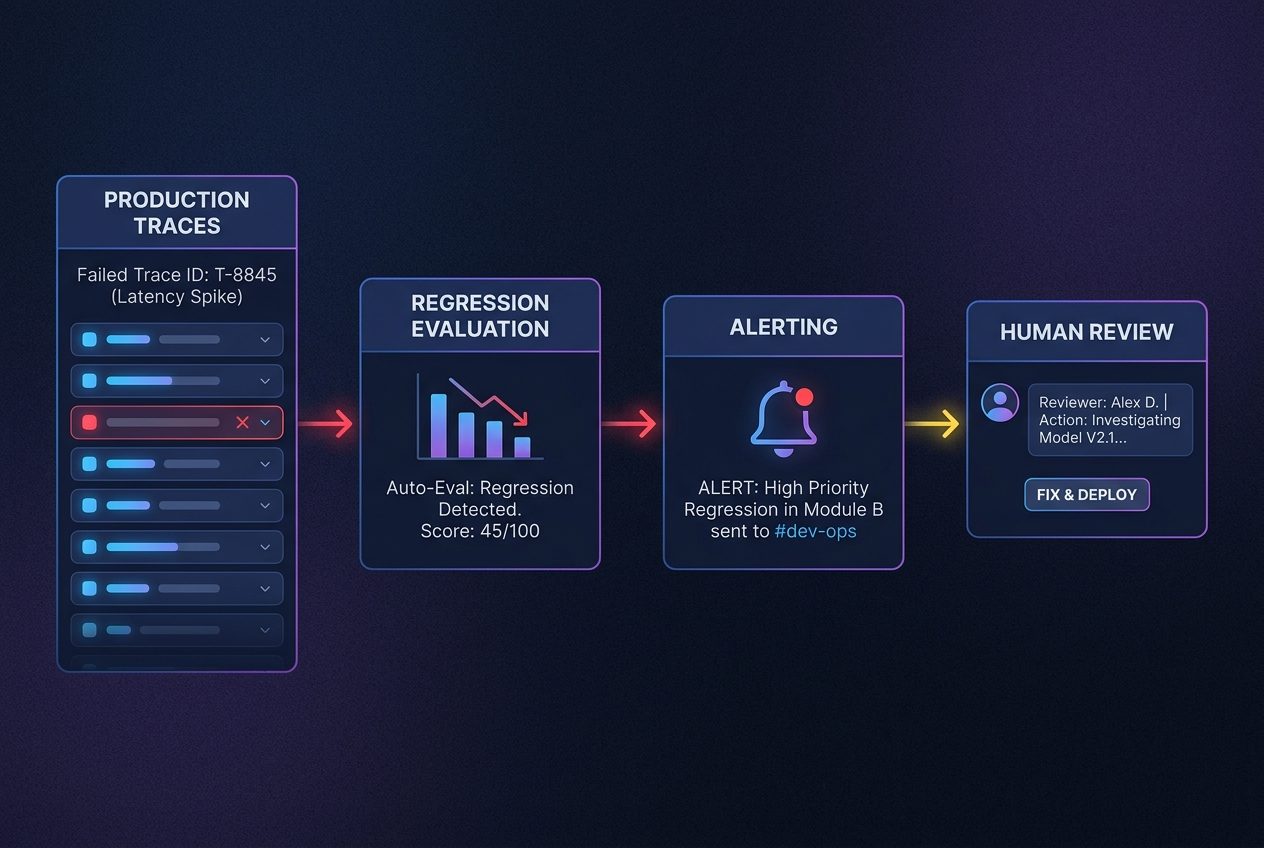
The strongest pattern is the incident-to-eval loop. When a production failure happens, inspect the trace, identify the responsible span, fix the smallest responsible component, then add an eval case that would catch the failure next time. The pillar article explains this broader debugging loop; this trace guide provides the raw evidence that makes the loop possible.
| Trace finding | Likely eval to add | Better long-term metric |
|---|---|---|
| Retriever selected irrelevant documents | Context relevance eval for the failing query class | Relevant-hit rate by workflow |
| Tool call succeeded but wrong tool was chosen | Tool-choice eval with labeled expected tool | Correct tool selection rate |
| Agent skipped approval | Policy-gate eval for side-effect actions | High-risk action approval coverage |
| Model produced unsupported answer | Groundedness and citation coverage eval | Unsupported claim rate |
| Retry loop inflated latency and cost | Recovery-path eval with max retry constraints | Cost per successful task |
This is where OpenTelemetry-style structure helps. If the trace has clear spans and attributes, your eval pipeline can select examples automatically. For instance, all traces with failure_class=bad_context and a low groundedness score can become candidates for a retrieval regression dataset. All traces with policy_block can be reviewed for whether the policy is too strict or correctly preventing risk.
Rollout Plan: Add Agent Tracing Without Freezing Development
Do not try to instrument everything in one sprint. Start with the workflow where failures are expensive, confusing, or common. Then create a trace contract, review it with engineering and security, and ship instrumentation behind a feature flag.
Week 1: Define the trace contract
Pick one agent workflow. Define root span name, child span names, allowed attributes, redacted fields, failure classes, and required outcome values. Decide whether raw prompt capture is disabled, sampled, or restricted. Write this contract in a short engineering document before code changes begin.
Week 2: Instrument the happy path
Add spans for the root run, model calls, tool calls, and retrieval. Do not chase every edge case yet. Confirm that traces appear in your backend and that developers can filter by agent version, outcome, model, and workflow.
Week 3: Add failure and safety visibility
Instrument exceptions, timeouts, rate limits, policy blocks, approval decisions, and human rejection. Add a basic dashboard for outcome distribution, latency by span type, token usage, and top failure classes.
Week 4: Attach evals and alerts
Connect traces to one or two evals. Add alerts for sudden failure spikes, cost-per-task jumps, approval bypasses, and high-severity policy blocks. Start sampling successful traces and retaining failed or near-miss traces longer.
What a good first dashboard should show
A first dashboard does not need dozens of charts. It should show the number of agent runs, success and failure outcomes, latency by span type, token usage by model, tool error rate, approval blocks, retry loops, and eval pass rate. Those views help the team notice whether a release made the agent slower, more expensive, less grounded, or more dependent on human intervention. If a chart cannot lead to a debugging action, remove it until the trace schema is mature enough to support it.
After launch: Make traces part of reviews
Use traces in incident reviews, prompt changes, tool releases, and model migrations. When someone proposes changing the agent’s system prompt, retrieval strategy, model, or tool permission, ask how the trace and eval results will prove the change helped.
Why This Cluster Article Supports the Pillar
Analytics for Singularity Journey are still sparse in Search Console, with the recent 28-day window showing low organic click volume and mostly homepage impressions. GA4 shows stronger engagement from direct and social traffic, while several AI agent and governance pages already receive page views. That makes internal topical structure important: new cluster articles should create precise support around existing agent reliability themes rather than chase broad news keywords.
The latest pillar targets AI agent observability, a broad topic that includes tracing, evals, metrics, debugging loops, security, and operational stacks. This cluster article narrows the angle to OpenTelemetry AI agent tracing. It avoids duplicating the pillar by focusing on trace schema, span design, attributes, redaction, and rollout. It links back to the pillar as the broader operating model and can receive a reciprocal link from the pillar’s trace anatomy or implementation sections.
The search gap is practical specificity. Many results discuss LLM observability platforms or OpenTelemetry concepts, but developers often need a concrete schema: root span, model span, retrieval span, tool span, memory span, approval span, eval span, and privacy rules. This article fills that gap with implementation-level guidance without becoming a vendor-specific tutorial.
Keep Building Reliable Agents
- AI Agent Observability: How to Trace, Evaluate, and Debug Production Agents — the source pillar for the broader observability system.
- How to Build a Secure MCP Server — useful when tracing tools, permissions, and approvals.
- Enterprise AI Agent Control Plane — connects traces with permissions, governance, and auditability.
- AI Guardrails Explained — background on safe AI controls that should appear in traces.
- AI Risk Thresholds Explained — useful for deciding which agent actions need approvals or alerts.
Sources and References
- OpenTelemetry: Generative AI semantic conventions notice
- OpenTelemetry GenAI semantic conventions repository
- OpenTelemetry blog: Observability for LLM-based applications
- LangSmith Observability documentation
- Arize Phoenix documentation
- OWASP Top 10 for Large Language Model Applications / GenAI Security Project
External links were selected from official project documentation or reputable project pages and exclude shortened, unrelated, promotional, or suspicious URLs.
FAQ: OpenTelemetry for AI Agent Tracing
What is OpenTelemetry AI agent tracing?
It is the practice of representing an AI agent run as a structured trace, with spans for model calls, retrieval, tools, memory, approvals, and evals. The goal is to debug behavior, latency, cost, and safety decisions across the full workflow.
Should every prompt and response be stored in traces?
No. Raw prompt and response capture can create privacy and security risk. Prefer template IDs, token counts, safe summaries, hashes, and controlled metadata by default. Store raw content only with explicit access control, redaction, and retention rules.
What is the most important span in an agent trace?
The root agent run span is the anchor, but tool, retrieval, and model spans usually explain the most production failures. Approval and eval spans are essential for high-risk agents.
How is agent tracing different from normal API tracing?
Normal API tracing explains infrastructure and service flow. Agent tracing also explains model behavior, tool choice, retrieved context, memory influence, policy decisions, and quality outcomes.
Can I use LangSmith or Phoenix with OpenTelemetry?
Yes. Specialized observability platforms can be useful while still following an OpenTelemetry-style mental model. The key is to keep span names, attributes, privacy rules, and eval links consistent.
What should I trace first?
Start with the highest-value production workflow. Trace the root run, model calls, retrieval, tool calls, approvals, and final eval result. Add deeper fields only when they answer real debugging questions.
How do traces help with agent evals?
Traces identify where and why a run failed. Evals turn those failures into repeatable checks, such as groundedness, tool-choice correctness, policy compliance, and task success.
