
AI Agent Trace Debugging: Find Failed Tool Calls, Bad Context, and Broken Handoffs
When a production AI agent fails, the final answer is only the symptom. The trace shows the path: prompts, retrieval, tool calls, approvals, retries, handoffs, latency, cost, and evaluator results.
AI agent trace debugging: the quick answer
AI agent trace debugging means reading the full timeline of an agent run to find where the system actually failed. Did retrieval return the wrong context? Did the planner choose the wrong tool? Did a tool call fail silently? Did the model ignore a tool result? Did a human approval step never fire? Did an evaluator reject the final answer for a reason the agent could not see?
The practical answer is simple: debug the trace before you debug the prompt. A prompt edit may hide the symptom for one example, but the trace can reveal the broken system boundary: missing context, bad schema, weak permission design, unreliable retries, or an evaluation gap.
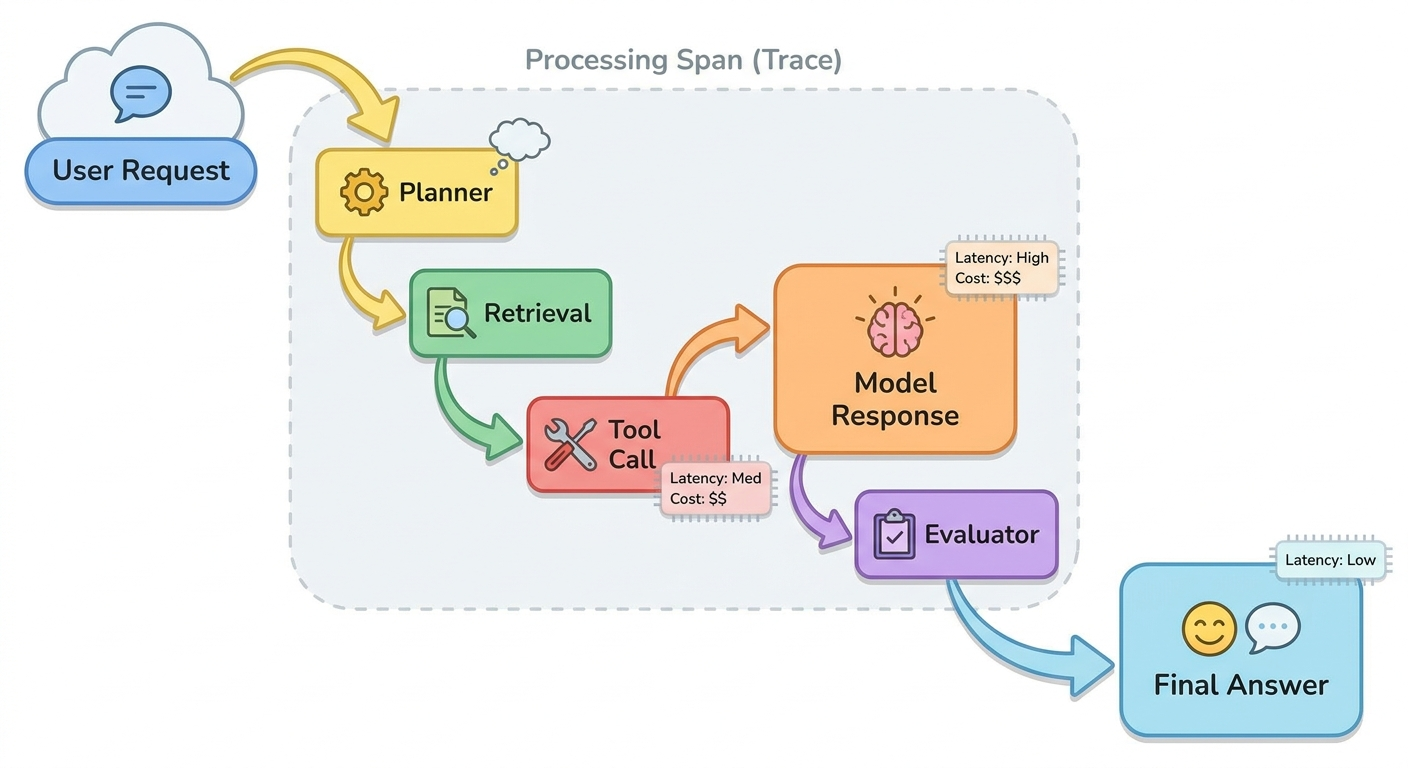
OpenTelemetry describes traces as the path a request takes through an application, with spans representing units of work that share a trace ID and form a hierarchy. For AI agents, that trace tree should include more than HTTP calls. It should include the planner step, model calls, retrieval steps, tool calls, MCP server interactions, approval events, memory reads, guardrail decisions, evaluator scores, retries, and final output.
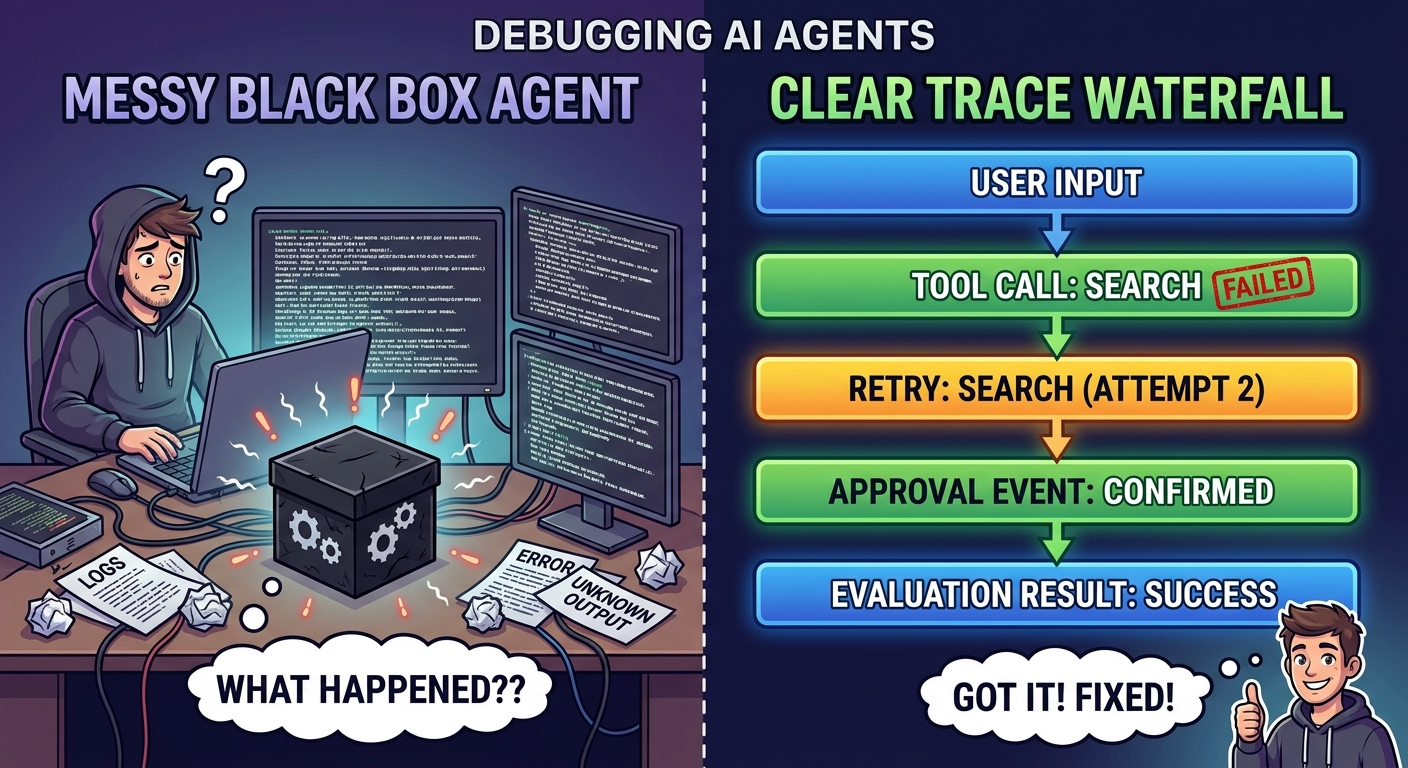
Why traces are better than final-answer debugging
Final-answer debugging is tempting because it is visible. The agent gave the wrong answer, missed a policy, called the wrong tool, or got stuck in a loop. But the final answer is usually several steps removed from the root cause. If you only inspect the output, you may blame the model when the real problem was a stale vector chunk, a malformed tool schema, missing auth, ambiguous memory, or a retry policy that repeated the same bad action.
Traces give developers a time-ordered path through the agent run. That matters because agents are not single model calls. They are small distributed systems wrapped around an LLM: prompts, tools, retrieval, state, memory, permissions, evaluators, queues, and humans. A trace lets you compare what the agent saw, what it decided, what it called, what came back, and what changed after each step.
This is also why trace debugging is a natural cluster topic for the broader observability pillar. The pillar shows the full monitoring architecture. This article gives the practical incident workflow developers need when a specific run goes wrong.
Trace fields to inspect first
You do not need a perfect observability platform to start. You need a consistent minimum trace shape. The table below is the fastest way to make agent incidents less mysterious.
| Trace field | What to capture | Debugging question it answers |
|---|---|---|
| Run ID and trace ID | Unique identifiers for the full user request and every related span. | Can we reconstruct the exact path of this failure? |
| User intent and route | Classified task, requested action, selected agent, and workflow branch. | Did the router send the task to the wrong agent or policy? |
| Prompt and context version | Prompt template ID, system instruction version, retrieved chunks, memory keys, and policy bundle. | Was the agent working from the right instructions and evidence? |
| Tool call details | Tool name, arguments, schema version, permission scope, response status, latency, and result summary. | Did the tool fail, return bad data, or receive malformed arguments? |
| Approval and guardrail events | Approval requested, approval skipped, reviewer outcome, blocked action, policy hit, and escalation reason. | Did safety controls fire at the right point? |
| Model and cost metadata | Model name, provider, token counts, latency, retries, timeout, and fallback path. | Was the failure caused by model behavior, budget, latency, or fallback logic? |
| Evaluator result | Automated checks, human review notes, rubric scores, regression-test ID, and pass/fail reason. | How do we convert this bug into a future test? |
Common AI agent failure patterns visible in traces
1. Bad context, good reasoning
The agent reasons sensibly from the wrong context. In the trace, retrieval spans show irrelevant chunks, stale documents, missing source metadata, or memory that should not have been used. Fix retrieval filters, chunk quality, recency rules, or memory controls before rewriting the prompt.
2. Good plan, bad tool call
The planner selects the right tool, but arguments are malformed, incomplete, or incompatible with the current schema. Inspect tool span inputs, schema version, validation errors, and retries. This often needs better tool descriptions, typed validation, or pre-call argument checks.
3. Tool succeeded, agent ignored it
The tool returns the right data, but the final answer does not use it. Look for context-window truncation, missing result summarization, weak instruction hierarchy, or a handoff span that dropped the tool result.
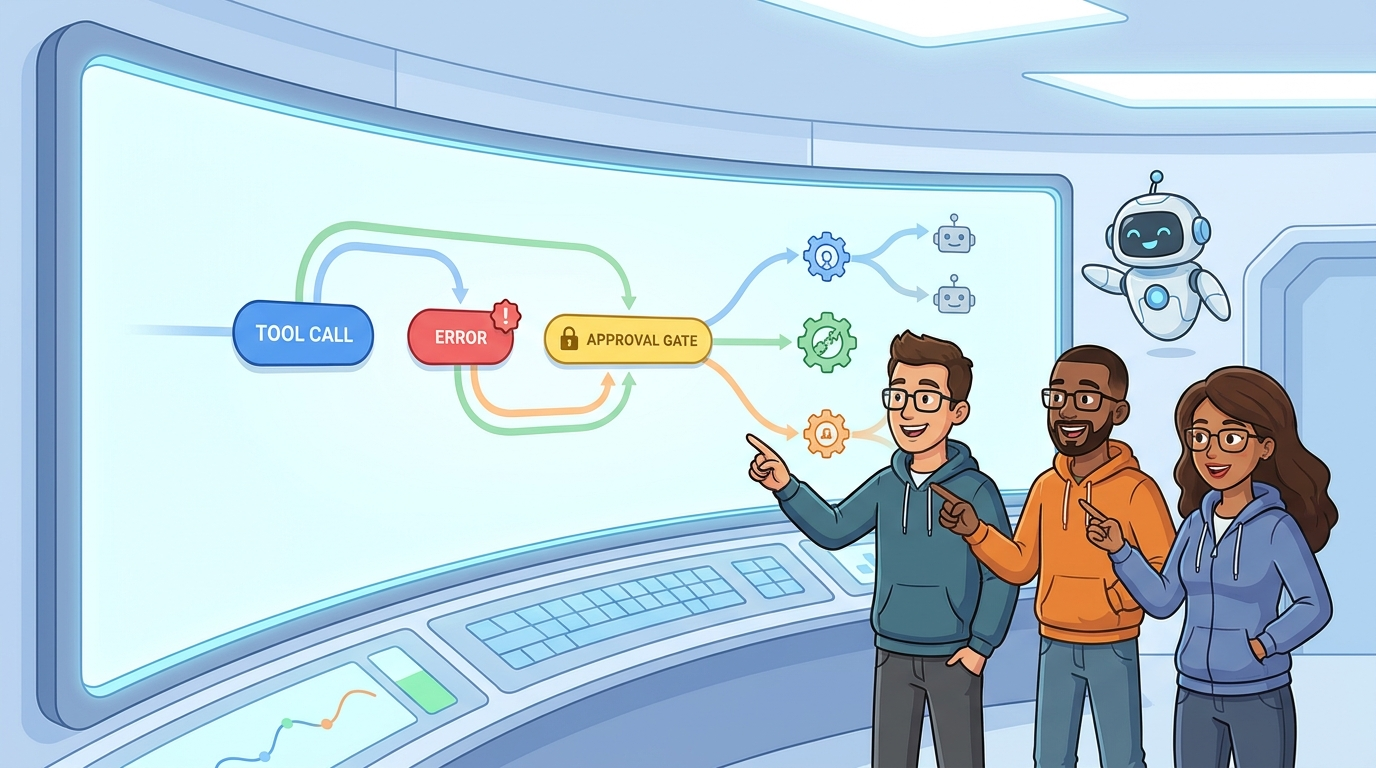
4. Approval gap
The agent performs or recommends a sensitive action without asking for review. Trace approval events should show whether the policy was evaluated, which threshold applied, and why approval was skipped. If the trace has no approval span, the control may not be wired into the workflow.
5. Retry loop
Retries repeat the same failing tool call or prompt path. Inspect retry count, backoff behavior, error class, and whether the agent changed strategy. Retries without new information are usually latency and cost bugs disguised as resilience.
6. Evaluator mismatch
The agent completes the task, but the evaluator fails it for reasons the agent never saw. Connect evaluator spans to rubric versions and failure reasons. If useful, feed the rubric into planning or add a pre-submit self-check.
A practical trace-debugging workflow
- Start with the failing run ID. Do not rely on screenshots or vague bug reports. Open the exact trace and confirm the user intent, route, model, tool permissions, and final output.
- Find the first wrong span, not the loudest span. A late failure may be caused by an earlier routing, retrieval, or state error. Walk the trace from root to leaf until the system state first diverges from expected behavior.
- Compare input, output, and decision at every boundary. Agent bugs often happen at boundaries: user to router, router to planner, planner to tool, tool to model, model to evaluator, evaluator to human.
- Separate model behavior from system design. If the model had no correct context, the fix is not use a smarter model. If the tool schema accepted ambiguous arguments, the fix is not prompt harder.
- Write the permanent fix as a test. Every serious trace failure should become a regression example, evaluation case, guardrail rule, schema validation, monitoring alert, or approval trigger.
Interactive first-check selector
Choose the symptom you see. This quick selector suggests where to inspect the trace first.
What went wrong?
Turn trace bugs into evaluations
A debug session should not end when the incident is fixed. If a failure matters, convert it into a repeatable evaluation. Save the input, expected behavior, relevant context, tool contract, policy condition, and evaluator rubric. Then run it whenever the prompt, model, retrieval system, tool schema, or approval rule changes.
This closes the loop between observability and reliability. Traces explain what happened. Evaluations ask whether it will happen again. That is why the strongest production AI teams treat incident traces as a source of test cases, not just troubleshooting artifacts.
Research and tooling around language-model pipelines increasingly emphasizes metrics, feedback, and optimization loops. The exact framework matters less than the habit: every important trace failure should produce a measurable expectation for future runs.
Trace-debugging checklist
- Confirm the exact run ID, trace ID, user intent, and workflow route.
- Inspect retrieved context, memory keys, and prompt/template version before editing prompts.
- Check tool name, schema version, arguments, permission scope, response status, and latency.
- Look for missing approval spans, skipped policy checks, or unclear escalation reasons.
- Find retry loops and verify whether each retry changed strategy or only repeated cost.
- Compare evaluator failure reasons with what the agent could see before final output.
- Write the fix as a regression test, guardrail, schema validation, alert, or approval trigger.
For the broader system design, return to the source pillar on AI agent observability. For related controls, read our guides on enterprise AI agent governance, human approval for AI agents, and AI agent memory controls.
Final takeaway
Good AI agent debugging is not guesswork. It is trace reading. Start with the run path, identify the first wrong span, separate model behavior from system design, and turn every serious incident into a test. That is how observability becomes reliability instead of just another dashboard.
FAQ: AI agent trace debugging
What is AI agent trace debugging?
AI agent trace debugging is the process of reading the full timeline of an agent run to find where the failure happened: routing, planning, retrieval, tool calls, approvals, retries, model output, handoffs, or evaluation.
What should an AI agent trace include?
At minimum, it should include a run ID, trace ID, user intent, route, prompt version, retrieved context, model call metadata, tool inputs and outputs, approval events, retry behavior, evaluator results, latency, and error status.
Is prompt logging enough for agent debugging?
No. Prompt logs are useful, but agents fail across system boundaries. You also need retrieval data, tool-call spans, permission checks, approval events, evaluator results, and retries.
How do I debug a failed tool call?
Inspect the tool span: tool name, schema version, arguments, permission scope, validation errors, response status, latency, retries, and whether the model used the returned result correctly.
How do traces connect to evaluations?
Traces explain what happened in a specific run. Evaluations turn important failures into repeatable tests so future prompt, model, retrieval, or tool changes do not reintroduce the same bug.


No comments:
Post a Comment