
DEV ZONE · Production AI agents · Tracing, evals, debugging
AI Agent Observability: How to Trace, Evaluate, and Debug Production Agents
Short answer: do not ship an AI agent as a mysterious chat box. Ship it like a distributed system: every run should have a trace, every risky action should have a permission trail, every failure should become an evaluation, and every tool call should be debuggable.
AI agents are harder to debug than normal software because the failure often lives between steps. The model misunderstood the goal, selected the wrong tool, used stale context, skipped a guardrail, retried silently, or produced a result that looked plausible but was not useful. If you only save the final answer, you lose the story.
That is why AI agent observability is becoming a core developer skill. A production agent needs more than prompt logs. It needs traces, structured events, tool telemetry, approvals, evaluations, safety checks, and a practical incident loop.
This guide explains how to build that loop without overengineering it.
Why agent observability is different from app monitoring
Traditional application monitoring tells you whether a service is slow, down, or throwing errors. Agent monitoring has to answer a more uncomfortable question: why did the system decide to do that?
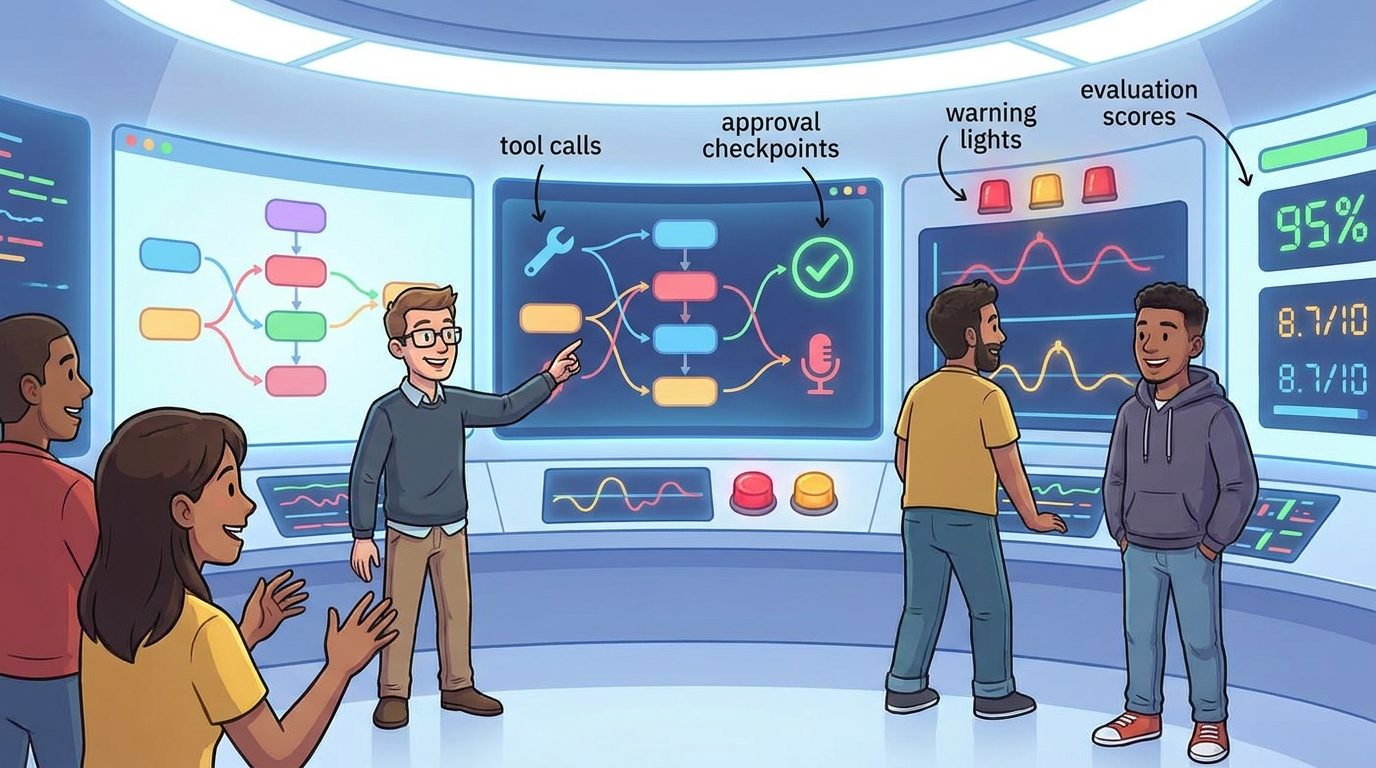
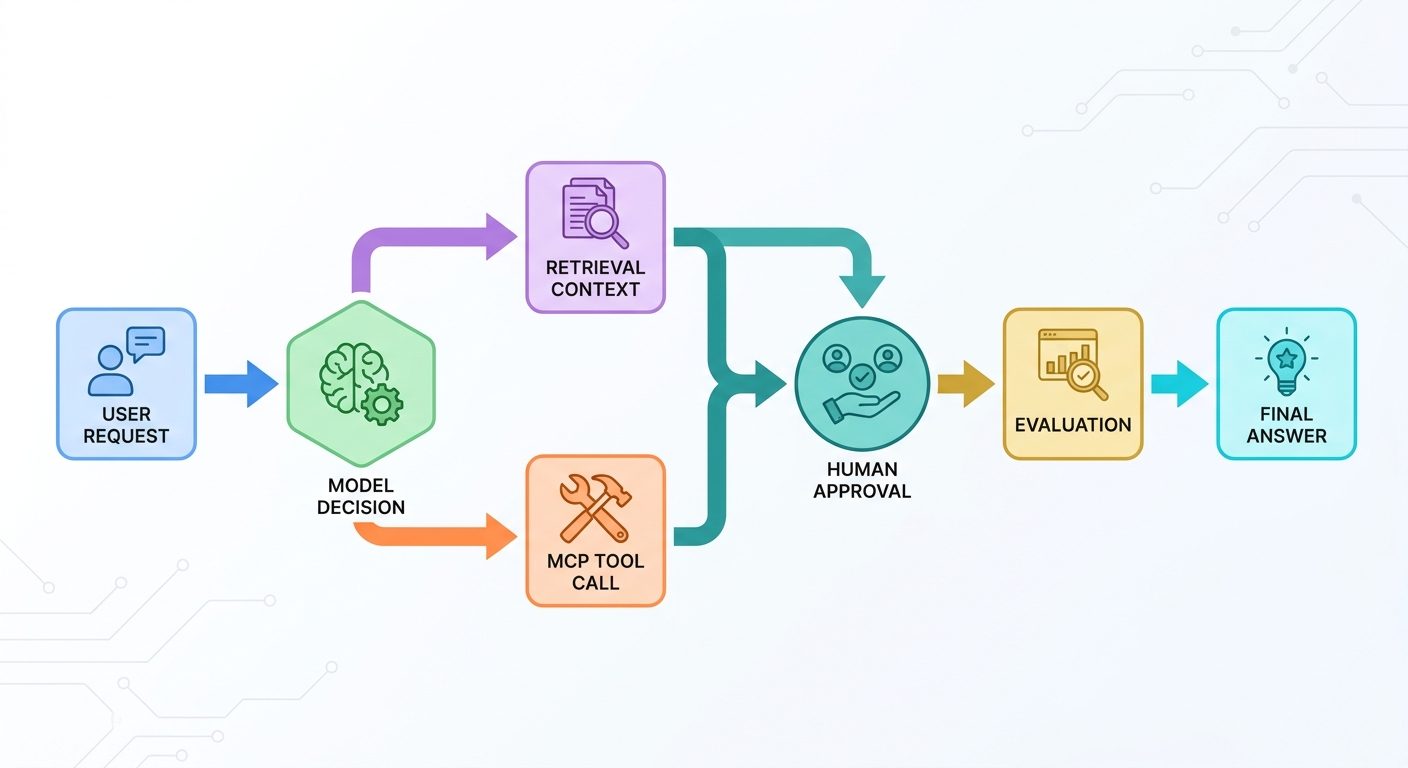
An AI agent usually combines model reasoning, tool selection, memory, retrieval, external APIs, permissions, and user approval. The Model Context Protocol describes this pattern as hosts connecting through clients to MCP servers that provide tools, data, and context. That architecture is powerful, but it also expands the number of places where a run can fail.
API timeout, bad deploy, database error, broken dependency.
Wrong intent, wrong tool, bad context, unsafe action, weak recovery, misleading answer.
Reconstruct the full path from user request to final outcome.
The production agent observability stack
A useful stack has six layers. You can start small, but skipping layers creates blind spots.
| Layer | What to capture | Why it matters |
|---|---|---|
| Run trace | Run ID, user request, steps, spans, parent-child relationships | Shows the path of the request through the agent |
| Model events | Model used, instructions version, structured output, refusal or uncertainty | Explains model-side behavior without relying on memory |
| Tool telemetry | Tool name, arguments, permission tier, response status, latency, retry count | Finds broken integrations and unsafe action patterns |
| Context records | Retrieved files, snippets, source IDs, memory entries, freshness | Detects stale, irrelevant, or missing context |
| Guardrails and approvals | Policy checks, approval prompts, reviewer decision, blocked actions | Creates accountability for risky actions |
| Evaluation results | Pass/fail, rubric scores, regression cases, human feedback | Turns incidents into measurable quality improvement |
OpenTelemetry is a strong mental model here because it defines traces as the path of a request through an application, composed of spans that share a trace ID. For agents, each model call, retrieval call, MCP tool call, approval, and final response can become part of the same trace.
What to trace in every agent run
Start with one rule: every agent run gets a unique run_id. Every event in the run carries that ID. If your agent calls sub-agents, tools, or MCP servers, each child operation gets a span ID and a parent span ID.
Minimum viable trace fields
- Run metadata: run ID, user ID or anonymized actor ID, environment, agent version, prompt/instruction version.
- Input: sanitized user request, attachments or context references, declared intent if classified.
- Planning: selected plan, tool candidates, risk classification, stop conditions.
- Tool calls: tool name, parameters after redaction, permission tier, result status, error message, latency.
- Approval events: requested action, reviewer, decision, reason, timestamp.
- Output: final answer, cited sources, confidence notes, task status.
- Cost and latency: model calls, tokens if available, time per step, retries.
Do not store secrets, raw private data, access tokens, or unnecessary personal information. Observability should make debugging easier without creating a bigger privacy problem.
Debugging the four most common agent failures
| Failure | Signal to look for | Fix |
|---|---|---|
| Wrong tool selected | Trace shows tool choice does not match user intent | Add tool descriptions, examples, routing evals, or a tool allowlist |
| Bad context | Retrieved snippets are stale, irrelevant, or missing source IDs | Improve retrieval filters, freshness checks, source ranking, and context display |
| Unsafe action | Write/destructive tool called without approval or risk label | Add permission tiers, human review, and deny-by-default policies |
| Silent degradation | Retries hide repeated errors; final answer looks normal | Expose retry counts, fallback paths, and degraded-mode warnings |
MCP security guidance is especially relevant for tool-connected agents. Proxy servers, authorization flows, consent, and client identity can introduce subtle risks. Treat every external tool as a permissioned integration, not just a function call.
Evaluations: turn bugs into regression tests
Tracing tells you what happened. Evaluations tell you whether it was good enough. Production agents need both.
Create an evaluation set from real failures and high-risk tasks. For each case, store the user request, allowed tools, expected behavior, unacceptable behavior, and scoring rubric. Then run the eval every time you change prompts, tools, models, retrieval settings, or guardrails.
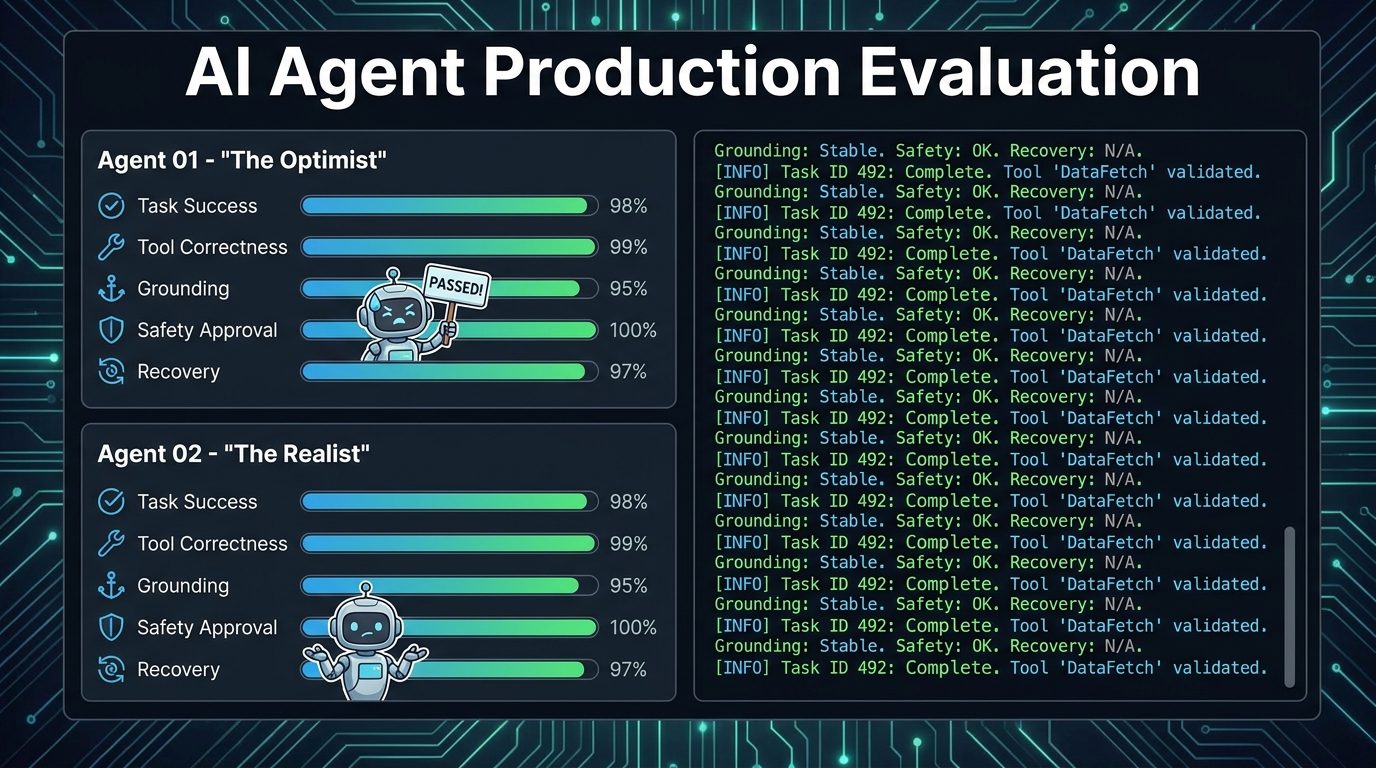
A practical agent evaluation matrix
| Eval type | Question it answers | Example rubric |
|---|---|---|
| Task success | Did the agent complete the user goal? | Correct, partially correct, failed, asked for needed clarification |
| Tool correctness | Did it choose the right tool and arguments? | Right tool, safe parameters, no unnecessary writes |
| Context grounding | Did the answer use the provided sources correctly? | Source-supported, cites relevant evidence, no invented claims |
| Safety and approval | Did risky actions trigger review? | Blocked, approved, escalated, or safely refused |
| Recovery | Did it handle errors honestly? | Retry reasonable, explain limitation, avoid fake success |
Metrics worth tracking without pretending they are magic
Avoid vanity metrics like total messages if they do not help you improve reliability. For agents, the useful metrics are operational and behavioral:
- Task completion rate: percentage of runs that finish with the intended outcome.
- Tool error rate: failed tool calls divided by total tool calls.
- Approval rate: how often the agent requests human review for risky actions.
- Override rate: how often humans reject or modify a proposed action.
- Eval pass rate: percentage of regression cases that pass after a change.
- Grounding failure rate: answers that cite weak, missing, or irrelevant sources.
- Rollback or correction rate: tasks that require manual repair after agent action.
The exact numbers will differ by product, so do not copy someone else’s benchmark blindly. Build your own baseline, then improve it.
Reference architecture for observable agents
- Agent runtime: handles user request, model calls, planning, memory, and tool decisions.
- Tool/MCP layer: exposes external actions with clear permission tiers and typed arguments.
- Telemetry collector: receives traces, logs, metrics, tool events, and approval records.
- Evaluation runner: replays curated scenarios against the current agent version.
- Review dashboard: lets developers inspect traces, compare outputs, and label incidents.
- Feedback loop: converts incidents into tests, prompt changes, tool fixes, or policy changes.
If you already use OpenTelemetry for application traces, extend the same discipline to agent spans. If you do not, begin with structured JSON events and a searchable run ID. The important part is not the vendor. The important part is reconstructability.
Internal build checklist
- Every run has a unique run ID.
- Every model call and tool call is attached to the run trace.
- Tool arguments are logged safely with secret redaction.
- Risky tools have permission tiers and approval events.
- Retrieval and memory sources are recorded by ID and freshness.
- Failed or suspicious runs can be converted into eval cases.
- Dashboards show tool errors, eval pass rate, approval rate, and degraded runs.
- Developers can inspect the complete path from request to answer.
Internal links for deeper reading
- AI Agents Explained: How They Work, What They Can Do, and Where They Still Fail
- How to Build a Secure MCP Server: Tools, Permissions, and Human Approval
- AI Agent Observability: The Control Layer Enterprise Agents Need in Production
- MCP Tool Risk Tiers: How to Classify Read, Write, and Destructive Agent Actions
- AI Agent Controls Explained
Sources and references
- Model Context Protocol introduction
- MCP architecture overview
- MCP security best practices
- OpenTelemetry documentation
- OpenTelemetry traces
- OpenAI Agents SDK documentation
FAQ
What is AI agent observability?
AI agent observability is the practice of capturing enough telemetry to understand an agent’s behavior: traces, logs, model events, tool calls, retrieved context, approvals, evaluation results, and user feedback.
Is prompt logging enough?
No. Prompt logs are only one slice of the system. A production agent also needs tool telemetry, approval records, structured outputs, context records, error handling, and evaluation history.
Should every tool call require human approval?
No. Read-only and low-risk tools can usually run automatically. Write, financial, external-message, privileged, or destructive tools should use explicit permission tiers and human approval when risk is meaningful.
How do I start if I have no observability system?
Start with structured JSON logs using a run ID, step ID, tool name, result status, latency, and error field. Then add eval cases from real failures. You can adopt OpenTelemetry-style tracing as the system matures.


No comments:
Post a Comment