
AI Agent Observability: How to Trace, Evaluate, and Debug Tool-Using Workflows
A reliable agent is not one that produces a convincing final message. It is one whose team can reconstruct what happened, measure whether it met a defined standard, and stop it safely when a tool call, retrieval step, or retry goes wrong.

AI Agent Observability: the Quick Answer
AI agent observability is the ability to inspect an agent run as a sequence of connected decisions and operations: the request that started it, the model responses, retrieval attempts, tool calls, retries, approvals, final outcome, latency, and resource use. It is more than a dashboard with a success counter. A useful system lets an engineer answer four questions about a specific run: what did the agent attempt, why did it take that path, what did each dependency return, and did the result meet the product’s definition of success?
That distinction matters because tool-using agents fail in ways that ordinary APIs do not. A normal service may return a clear error after one database query. An agent may receive an ambiguous tool result, reformulate a query, call a second tool, exceed a budget, repeat an action, or produce an answer that sounds confident even though a required authorization check never happened. Looking only at the final text erases the evidence needed to fix the system.
This guide is for teams moving from a promising prototype to a workflow that can be operated. It does not assume a particular framework. OpenAI Agents SDK, LangChain or LangGraph, custom orchestration, Microsoft Foundry, and other stacks can all emit the same essential evidence. The implementation details differ; the operating discipline does not.
Why Final Answers Are Not Enough
An agent’s final answer is an outcome, not an explanation. Imagine an internal support agent that responds, “Your access has been updated.” The message may be correct. It may also hide a failed permission lookup, a stale identity record, an unauthorized write, or a retry that updated the same account twice. A green “response delivered” metric cannot separate these cases. A trace can.
Production agents are chains of uncertain operations. The planner interprets the request. The model chooses whether to use a tool. A retriever selects context. A tool may fail, time out, rate-limit, return partial data, or make an irreversible change. A guardrail might reject the request. A human might approve or deny it. Each transition deserves an observable event because each can change both user value and risk.
The recent emphasis on standard telemetry is useful here. The OpenTelemetry GenAI observability guidance describes recording model operations, token data, and optionally prompt, completion, tool-call, and tool-result content. Its point is not that every team should store every byte. Its point is that common, correlated fields make it possible to see whether a slow answer came from a model, tool call, retry loop, or downstream service. The OpenAI Agents SDK tracing documentation similarly treats a run as a trace with nested spans for generations, tools, handoffs, and guardrails.
Observability changes the questions a team asks. Instead of “Did the chatbot work?” ask “What fraction of successful answers used an approved tool path?” Instead of “Why was this run slow?” ask “Which span contributed the p95 latency, and did retries amplify it?” Instead of “Can we trust the agent?” ask “Can we inspect a representative failure, reproduce it, and prove that the control we added works?” Those questions lead to buildable requirements.
Build a Trace Model Before Choosing a Dashboard
A vendor dashboard can accelerate onboarding, but it should not define the mental model. Start by naming the unit of work you want to understand. For most agents, that is an end-to-end trace beginning when a user, schedule, or upstream service invokes the workflow and ending when the workflow returns, escalates, or stops. Attach a stable trace identifier at the boundary and propagate it across queues, services, and tools.
Inside that trace, record spans for meaningful operations. A model-generation span records the model, request settings, token counts where available, latency, and finish reason. A retrieval span records the corpus or index version, query class, result count, and selected-document identifiers. A tool span records the tool name, version, input schema version, authorization outcome, execution status, latency, and sanitized result summary. A handoff span records which specialist received work and why. A guardrail span records the policy checked and decision. A human-approval span records that a checkpoint occurred without leaking unnecessary personal data.
| Layer | What to capture | What it answers |
|---|---|---|
| Run | Trace ID, workflow version, user or tenant pseudonym, outcome, stop reason | What happened to this request? |
| Model | Model, prompt template version, latency, token counts, finish reason | Was the model slow, truncated, or unusually expensive? |
| Retrieval | Index version, query class, document IDs, result count, grounding check | Did the agent have appropriate evidence? |
| Tool | Name, schema version, authorization, status, retry count, safe result summary | Which dependency or action failed? |
| Control | Policy, approval decision, escalation, stop condition | Did the workflow follow its safety boundary? |
Make the schema versioned. Teams often instrument an early prototype, then silently change prompts, tools, and routing logic until traces from different releases can no longer be compared. Include a workflow version, prompt identifier, tool version, and evaluation-set version. These fields convert a vague claim that “the latest change got worse” into an analysis that compares equivalent traffic across two explicit versions.
Also decide what not to capture. Full prompt and tool-result bodies may be valuable during a tightly controlled development test, but they can carry credentials, customer details, regulated data, or proprietary documents in production. Store structured metadata by default, redact known sensitive fields before export, restrict access, and use short retention for any sampled content. Observability should increase accountability, not create a new data leak.
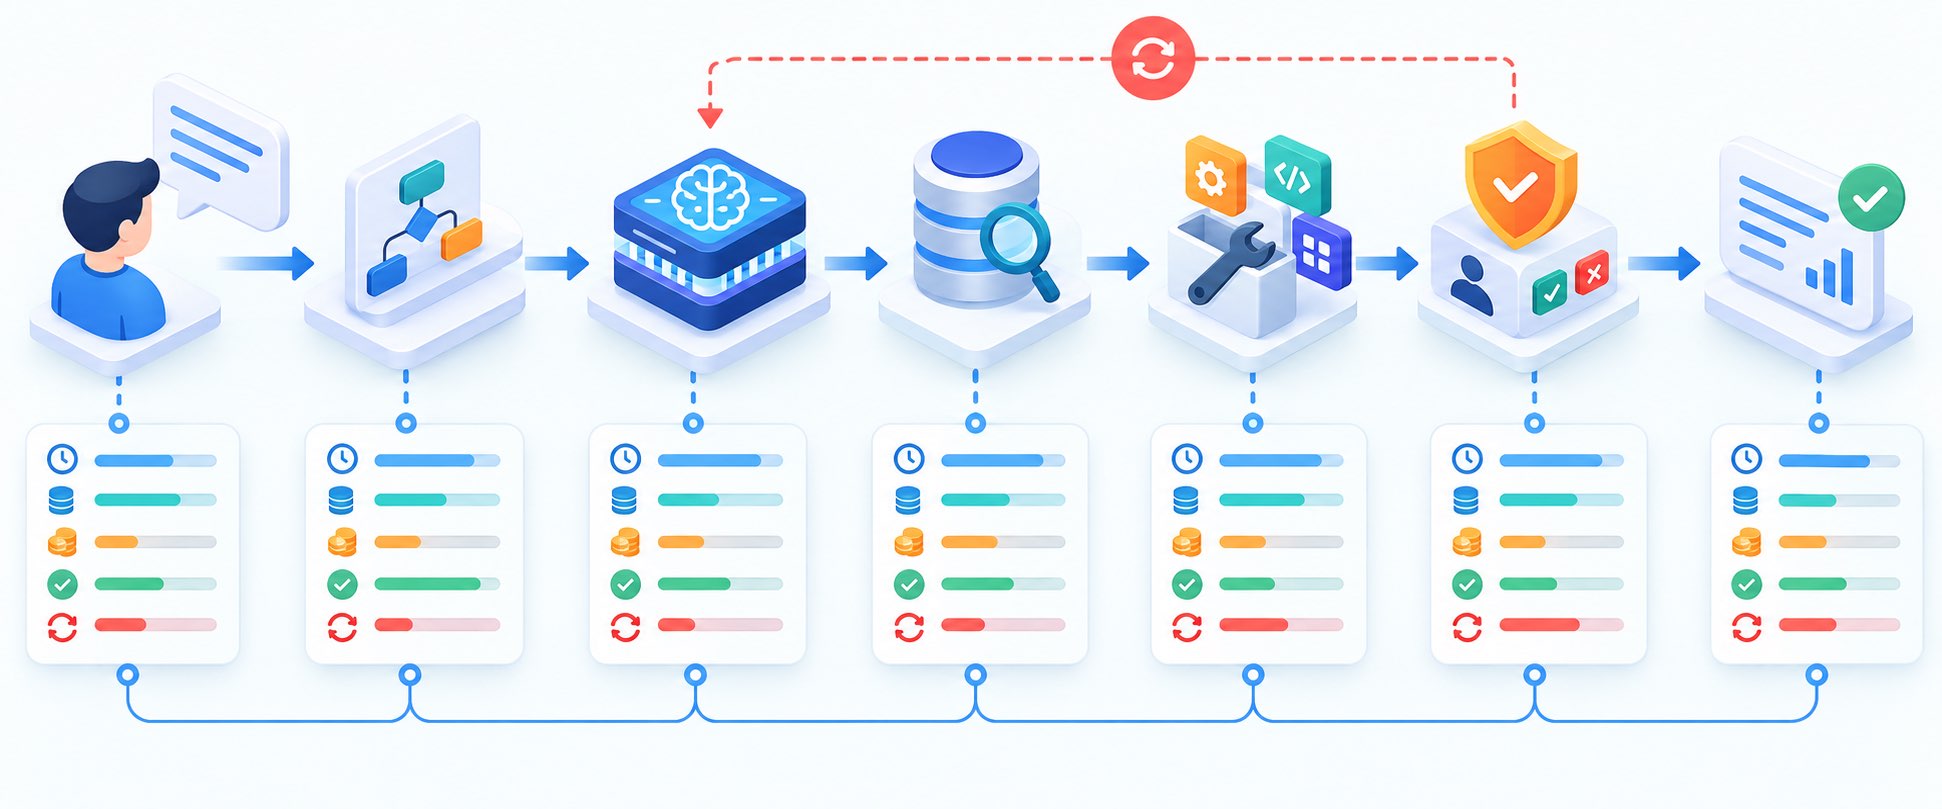
Measure Outcomes, Paths, and Costs Together
Teams commonly start with latency and error rate because traditional services trained them to do so. Those are necessary, but an agent can be fast and wrong. It can return a fluent answer while missing a source, performing the wrong tool action, or stopping just before the useful step. It can also be technically correct but so slow or expensive that the workflow is not viable. A complete scorecard combines outcome quality, process quality, safety, and operations.
Choose metrics from the product contract, not from what the platform exposes by default. For a research assistant, source support and citation correctness may matter more than tool latency. For a purchasing agent, authorization adherence and duplicate-action prevention may be non-negotiable. For a triage agent, correctly escalating uncertainty may be more valuable than autonomous completion. Define a small number of primary measures and a set of guardrail measures that must not degrade.
Use distributions rather than a single average. An average run that costs little can hide a small but damaging tail of long loops. Inspect p95 and p99 latency, expensive-run percentiles, tool-error concentration, and the highest-step traces. Segment the analysis by task class, customer tier, language, tool path, or workflow version only when those dimensions are legitimate and privacy-safe. The goal is to identify a concrete failure mode, not produce an elaborate dashboard.
Turn Traces Into an Evaluation System
Tracing is evidence collection. Evaluation is the repeatable judgment layer built on that evidence. An offline evaluation asks an agent to handle a curated set of inputs and scores the result against an expected outcome, rubric, policy, or ordered tool sequence. An online evaluation reviews real or sampled production traces after the fact. Use both. Offline tests prevent known regressions before a release; online review catches unfamiliar traffic and changes in tools, data, or user behavior.
Microsoft’s agent evaluation guidance recommends a task-specific rubric plus safety checks and an acceptance threshold before release. It also supports turning captured production traces into datasets, which is an important pattern: the failures users actually encounter should become regression cases after they are sanitized and approved for reuse. The objective is not an ever-growing benchmark for its own sake. It is a test suite that represents the decisions your system must make well.
Use layered judges
Some checks should be deterministic. Did the agent call an approved tool? Did it attempt a write without approval? Did it exceed the maximum step count? Did the final payload validate against the schema? Deterministic checks are cheap, reproducible, and excellent at enforcing workflow rules. Other questions require a rubric or human review: was the summary faithful to supplied evidence, did the answer satisfy the user’s goal, and was an escalation appropriate? An LLM-based judge can be useful for triage, but it should be calibrated against expert samples and never become an unquestioned source of truth.
Score trajectories when the path matters
For a tool-using agent, a correct final answer can be insufficient. Consider an account-change workflow where the agent reaches the right result after calling an unapproved tool, or a procurement workflow that gets a quote but ignores a required policy lookup. Evaluate the trajectory: tool choice, action order, authorization, evidence use, and stop reason. The LangChain agent evaluation docs illustrate this idea with strict checks for message and tool-call sequences. Not every workflow needs strict ordering, but high-risk paths often do.
Keep the evaluation record with the trace. Store the evaluator version, dataset version, rubric, score, human override, and rationale. When a quality chart moves, you should be able to determine whether the agent changed, the evaluator changed, the traffic changed, or the data was mislabeled. That discipline prevents teams from optimizing to a mysterious score rather than to product reality.
A Trace-First Debugging Runbook
When an agent incident arrives, resist the urge to start by rewriting the prompt. First find the trace and classify the failure. Was the final answer unsupported? Did a tool return an error? Did retrieval return no relevant context? Did a tool return good data that the model ignored? Did a guardrail fire too late? Did a stop condition fail? The trace should make the earliest broken assumption visible.
- Find the complete run. Start with a trace ID, request timestamp, workflow version, and sanitized user context. Confirm that all expected child spans arrived.
- Locate the first divergence. Compare the path to a known-good trace for the same task class. The first unexpected tool, missing approval, empty retrieval, or unusual retry usually matters more than the final fluent response.
- Separate dependency failure from agent failure. A timeout, stale credential, or malformed tool response needs an integration fix. A tool chosen for the wrong reason may need better constraints, examples, routing, or policy.
- Reproduce safely. Replay against a test tenant, fixture, or dry-run tool. Do not blindly replay an action that can alter customer or financial records.
- Add a regression case. Turn the incident into a test with an expected trajectory or outcome. Then verify the fix against nearby cases, not only the exact failing prompt.
Looping deserves explicit attention. Agents often get stuck when a tool error is presented as ambiguous natural language, a tool result does not satisfy a hidden condition, or the planner believes another retry will help. Record step count, repeated-call signatures, per-tool retry count, cumulative cost, and stop reason. Add hard limits before production: maximum steps, per-tool retry caps, timeout budgets, spend thresholds, and a defined escalation path. These are not signs of weak autonomy. They are how a system stays recoverable.

Privacy, Security, and Auditability Are Design Requirements
Agent telemetry can be unusually sensitive because it joins user requests, retrieved documents, model inputs, tool arguments, and action results into one searchable record. Treat trace design as part of your threat model. Begin with a data inventory: which fields can contain personal information, secrets, payment information, health data, credentials, internal identifiers, or customer content? Then apply minimization before data leaves the application boundary.
Prefer allowlists over best-effort redaction. Define the fields each span is permitted to emit, hash or pseudonymize identities where you only need correlation, and strip headers, credentials, raw tokens, and unneeded documents. Encrypt stored telemetry, separate tenant access, audit viewers, define retention limits, and give incident responders a controlled way to request a temporary higher-detail sample. A long-lived, broadly accessible prompt archive is not observability maturity.
Consider the action audit separately from model quality. For high-impact tools, record a durable event that identifies the workflow version, authorization state, approval or policy decision, idempotency key, action target, and result status. This helps teams answer whether an agent performed an action, but it also helps prevent double execution when a retry crosses a timeout boundary. The action ledger should be resilient even if the richer trace pipeline is sampled or delayed.
A Practical Rollout Plan for Existing Agents
You do not need to retrofit every metric in one sprint. Start with the workflows where a wrong action, silent failure, or high cost would matter most. Instrument one representative path end to end, check trace completeness under load, and inspect real traces with the people who maintain the tool integrations. Their feedback will reveal fields that are missing, noisy, unsafe, or too expensive.
| Phase | Deliverable | Exit question |
|---|---|---|
| 1. Map | Workflow diagram, tool inventory, risk boundary, success definition | Do we know what must be observable and what must never be stored? |
| 2. Instrument | Trace context, model/tool/guardrail spans, error taxonomy, redaction | Can we reconstruct a representative run across dependencies? |
| 3. Baseline | Latency, cost, completion, safety, and path metrics by task class | Do we know normal behavior and its tail? |
| 4. Evaluate | Curated cases, deterministic checks, calibrated rubric, release gates | Can a change prove it did not regress critical behavior? |
| 5. Operate | Alerts, incident runbook, sampled trace review, regression intake | Can the on-call team diagnose and contain a real failure? |
Use a small initial release gate. For example: no critical policy violation in the curated suite; trace completeness above a defined threshold; no increase in expensive-loop rate; and no statistically meaningful drop in task success for the target task class. Do not claim universal quality from a small sample. Say what the gate covers, observe production carefully, and expand the test set as real failures teach you more.
The related production practices on Singularity Journey can help sequence the work. Start with agentic AI stop conditions to bound retries and actions; use the AI agent deployment pipeline for release structure; and connect alerts to the agent debugging runbook. Those articles solve adjacent problems. Observability is the evidence layer that lets them work together.
Common Failure Patterns and the Evidence They Need
Observability becomes easier to prioritize when it is attached to real failure patterns rather than abstract platform features. The most frequent production surprises are rarely spectacular model failures. They are ordinary engineering problems made harder by probabilistic routing and multi-step execution: an integration changed its response shape, a retrieval index lagged behind the source of truth, a user request fell outside the examples in the prompt, or a retry changed the meaning of an action. The trace should make these distinctions visible without requiring an engineer to reconstruct them from scattered logs.
Unsupported but plausible answers
An answer can be articulate and still be ungrounded. Record whether retrieval was attempted, which document identifiers were selected, whether an answer cited or relied on those documents, and whether the workflow detected that evidence was missing. Do not infer factual quality solely from a confidence score. A better control is a policy that routes low-evidence tasks to clarification, an approved search path, or a human. Evaluate representative answers with a rubric that checks claims against the sources the agent actually had.
Wrong tool, right-looking output
Tool selection errors are dangerous because the final response can look normal. A finance agent may use a search tool where it should use an authorized ledger. A support agent may update a record after resolving the wrong identity. Trace the declared intent, selected tool, authorization decision, tool arguments after redaction, schema validation result, and tool response status. For sensitive workflows, use deterministic trajectory checks: a permission check must precede a write; an idempotency key must exist; a denied approval must terminate the run. These checks are easier to defend than a vague instruction asking the model to be careful.
Successful retries that hide instability
A retry can be sensible, but repeated recoveries may signal a fragile dependency or an agent that misunderstands a result. Track first-attempt success separately from eventual success. Break down retries by tool, error class, workflow version, and task class. If a run succeeds only after three retries, it may be acceptable for a low-impact research task but unacceptable for an action with a deadline or side effect. This is why stop conditions, backoff, and idempotency belong in the same conversation as observability.
Evaluation scores that drift away from users
A score can improve because the agent improved, because the evaluator became more lenient, or because the test set became easier. Keep blind human-review samples, preserve examples where evaluators disagreed with experts, and regularly audit the dataset for over-represented paths. An LLM judge is particularly useful for prioritizing reviews and finding patterns at scale, but it needs calibration and monitoring too. When a release changes a score, examine several traces behind the number before deciding what to optimize.
The useful end state is a short incident narrative that a different engineer can follow: the workflow version received this task; retrieval returned no valid evidence; the agent nevertheless called a write tool; the policy was missing; the action was blocked by the tool; a regression case and pre-tool policy check fixed the issue. That narrative is operational knowledge. A dashboard is valuable when it helps produce it quickly.
Make Observability Part of the Agent Contract
The most useful agent systems do not ask users to trust a black box. They give builders a way to inspect an outcome, understand the path that produced it, measure whether it met a real standard, and improve it without guessing. That is the promise of AI agent observability.
Start with one critical workflow this week. Map the decision path, name its unsafe actions, add trace context at the entry point, and inspect ten representative runs with the people who own the dependencies. The first useful trace will expose a question your prototype never made visible.
Begin with a trace model that reflects your workflow, instrument model calls and tools with safe structured fields, set stop conditions, and connect representative traces to evaluation cases. Then treat incidents as learning material: classify the failure, repair the earliest broken assumption, and add a regression test. This approach is less glamorous than a demo, but it is what makes an agent dependable after the first hundred requests.
Sources and Further Reading
FAQ: AI Agent Observability
What is AI agent observability?
It is the practice of collecting connected, safe telemetry about an agent run so a team can inspect model calls, retrieval, tools, controls, latency, cost, and outcomes rather than judging only the final answer.
What is the difference between tracing and evaluation?
Tracing records what happened in a run. Evaluation applies a rubric, expected result, policy, or deterministic check to decide whether the run met a defined standard. Mature systems use both.
Which metrics should an AI agent team track first?
Start with task completion, critical policy compliance, trace completeness, latency, error class, step count, tool retry rate, and cost per accepted outcome. Add product-specific quality metrics next.
Should production traces store prompts and tool outputs?
Only when there is a clear, controlled need. Prefer structured metadata, redaction, access controls, short retention, and sampled content. Do not treat raw customer content or credentials as routine logs.
How do you stop costly agent loops?
Instrument repeated-call signatures and step counts, then enforce maximum steps, retry caps, timeouts, spend thresholds, and an escalation path. Use failure traces to create regression tests.
